TikTok Comment-to-View Ratio Statistics 2026
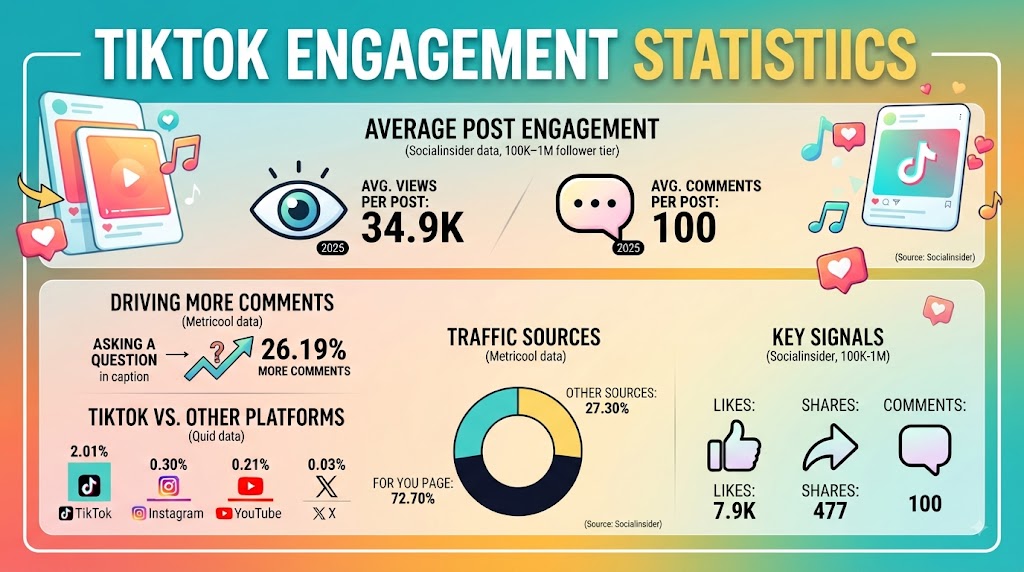
Accounts with 100,000 to 1 million followers averaged 100 comments and 34,900 views per TikTok post in 2025, according to Socialinsider. No major benchmark publisher reports a comment-to-view ratio as a standalone metric. This piece covers what the four largest 2026 TikTok studies measured, which numbers are actually published, and why the ratios circulating in roundups cannot be traced to a primary dataset.
TikTok Comment-to-View Ratio
How Is the TikTok Comment-to-View Ratio Calculated?
Socialinsider calculates engagement rate by views as likes plus comments plus shares plus saves, divided by views, multiplied by 100. Comments and views are then published separately, each as an average per post.
Those two averages sit over their own bases. Dividing one by the other returns the ratio of two averages, not the ratio a typical account records.
Multiplying an engagement rate by a comment share gives a third answer again, and saves are inside Socialinsider’s formula but are not published as a separate average. The published components are reported below without a manufactured ratio on top of them.
TikTok Comments Per Post By Account Size
Average comments per post rose in every follower tier between 2024 and 2025. Socialinsider puts the overall change near 3%, with accounts above 100,000 followers climbing 11% to reach the 100-comment mark.
| Account size | Average comments per post, 2024 | Average comments per post, 2025 |
|---|---|---|
| 1K–5K | 7 | 8 |
| 5K–10K | 10 | 15 |
| 10K–50K | 23 | 25 |
| 50K–100K | 37 | 40 |
| 100K–1M | 90 | 100 |
Source: Socialinsider, 2026 TikTok Benchmarks, dataset of 2M videos from 214,507 profiles active January 2024 – December 2025
The 5K–10K tier moved from 10 to 15, the only jump large enough to reset what a normal post looks like at that size. Tier position still tracks closely with engagement rate by follower count.
Why The TikTok Comment-to-View Ratio Shifts With Account Size
Views moved in two directions across the same tiers and the same dataset. Accounts at 1K–5K followers fell from 860 to 350 average views per post. Accounts at 100K–1M rose from 25,198 to 34,900.
| Account size | Average views per post, 2024 | Average views per post, 2025 |
|---|---|---|
| 1K–5K | 860 | 350 |
| 5K–10K | 1,575 | 945 |
| 10K–50K | 3,655 | 3,240 |
| 50K–100K | 8,688 | 9,900 |
| 100K–1M | 25,198 | 34,900 |
Source: Socialinsider, 2026 TikTok Benchmarks, January 2024 – December 2025
Socialinsider records an average 23% decrease in views for smaller accounts. Comments and views come from one dataset and one set of tiers, so the two columns can be read side by side without conversion.
TikTok Comment-to-View Ratio In Context: Likes And Shares
Comments are the smallest public signal at every account size. A 100K–1M account averaged 7,900 likes, 477 shares and 100 comments per post in 2025.
| Account size | Likes per post, 2025 | Comments per post, 2025 | Shares per post, 2025 |
|---|---|---|---|
| 1K–5K | 330 | 8 | 40 |
| 5K–10K | 595 | 15 | 60 |
| 10K–50K | 1,325 | 25 | 120 |
| 50K–100K | 2,675 | 40 | 200 |
| 100K–1M | 7,900 | 100 | 477 |
Source: Socialinsider, 2026 TikTok Benchmarks, calendar year 2025
Shares grew fastest. Socialinsider reports shares up to 13% year over year overall and 44% for the largest accounts, against 11% for comments in that same tier. Saves feed the engagement formula but are never published on their own, which is why organic and sponsored benchmarks rarely reconcile.
TikTok Engagement Rate By Industry
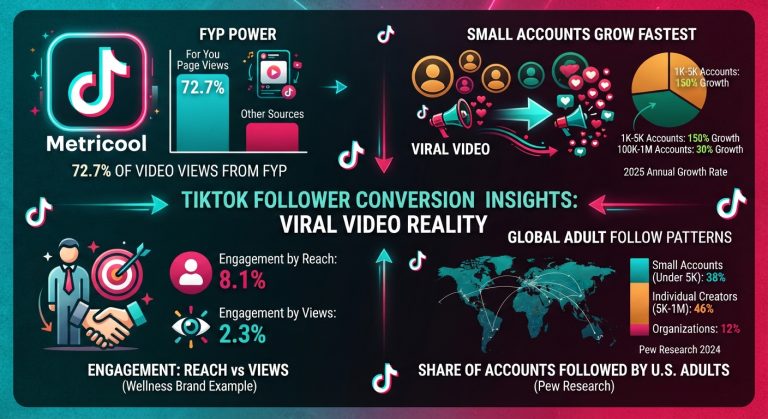
Dash Social reports TikTok engagement two ways for each industry. Publishing leads on views at 5.3%. Wellness ranks last on views at 2.3% and first on reach at 8.1%, the widest gap in the set.
| Industry | Followers | Weekly posts | Engagement rate / views | Engagement rate / reach |
|---|---|---|---|---|
| Publishing | 582.3K | 11 | 5.3% | 6.1% |
| Media and Entertainment | 1.8M | 18 | 4.8% | 5.1% |
| Travel | 415.5K | 4 | 3.5% | 4.2% |
| Beauty | 411.9K | 8 | 2.8% | 4.1% |
| Wellness | 133.7K | 6 | 2.3% | 8.1% |
Source: Dash Social, 2026 TikTok Benchmark Report, H1 2026 edition
Brand accounts in the sample average 559.9K followers and eight posts per week. Dash Social found that brands posting fewer than six times per week recorded 93% higher engagement, a result worth reading against posting frequency and growth data.
What Raises TikTok Comment Rates?
Metricool compared 2,314,756 TikTok posts from more than 92,000 accounts across two matched windows. Captions carrying a question drew 26.19% more comments.
| Factor | Metric affected | Measured effect |
|---|---|---|
| Caption includes a question | Comments | 26.19% more |
| Caption asks for comments | Engagement | 14% higher |
| At least one hashtag | Views | Nearly 5% more |
| At least one hashtag | Interactions | More than 9% more |
| Video vs image or carousel | Reach | 5x more |
| Video vs image or carousel | Interactions | 6x more |
Source: Metricool, 2026 TikTok Study, January–February 2025 compared with January–February 2026
Metricool reports the opposite effect for like requests, a 60% drop, described as fewer interactions in its TikTok trends write-up and fewer likes in its algorithm guide. Question placement interacts with caption length and with completion rate.
Posts reach 96% of their total reach and nearly 98% of their total interactions within the first 10 days. Views fell 31.30% year over year, reach 28.73% and interactions 31.17%.
Views and interactions dropped by close to the same amount, which leaves the interaction-to-view relationship steadier than either count on its own. Metricool also recorded 72.10% more videos published, alongside a rise in multi-part series content.
Why TikTok Comment-to-View Ratio Benchmarks Disagree
Quid’s 2026 report puts TikTok’s median engagement rate at 2.01%, calculated as total interactions divided by follower count. Socialinsider’s figure for 2025 is 4.20% by views, and 3.85% averaged over the first half of 2026.
| Platform | Median engagement rate by followers |
|---|---|
| TikTok | 2.01% |
| 0.30% | |
| YouTube | 0.21% |
| X | 0.03% |
Source: Quid, 2026 Social Media Industry Benchmark Report, published March 2026; medians across 18 industries, 150 companies sampled at random per industry
Quid’s median holds on 1.98 TikTok videos per week against 3.69 Instagram posts. Socialinsider’s engagement rate by views stayed between 4.20% and 4.30% for five consecutive quarters from Q1 2025 to Q1 2026, then fell to 3.85% in Q2 2026, an 8% quarterly drop.
Dash Social’s own pages label 3.4% and 4.4% inconsistently: its benchmark table lists 3.4% by followers and 4.4% by views, while its FAQ describes 3.4% as the by-views average. Any comment-to-view ratio inherits the denominator of whichever study produced it, which is why a quoted benchmark means little without its sample and formula attached. The same caution applies to category-level engagement figures and to video length benchmarks.
FAQs
What is a good TikTok comment-to-view ratio?
No benchmark publisher reports one. Socialinsider publishes average comments per post and average views per post separately. At 100K–1M followers those were 100 comments and 34,900 views in 2025.
Why do Reddit threads quote different TikTok comment-to-view ratios?
Each thread derives its own figure. Socialinsider’s engagement formula includes saves and divides by views, while dividing two published averages gives another answer. Check which denominator a Reddit number used before comparing.
How do you get more comments on TikTok?
Metricool found posts with a question in the caption receive 26.19% more comments, comparing January–February 2026 with the same window a year earlier. Asking for comments raised engagement 14%.
Do TikTok comments rise as an account grows?
In raw count, yes. Socialinsider recorded average comments per post rising from 7 to 8 at 1K–5K followers and from 90 to 100 at 100K–1M between 2024 and 2025.
Which TikTok engagement benchmark should I use?
Match the denominator. Quid’s 2.01% median divides interactions by followers. Socialinsider’s 4.20% for 2025 divides by views. Reddit posts and roundups routinely mix the two, which is where most confusion starts.
Sources
https://www.socialinsider.io/social-media-benchmarks/tiktok
https://www.dashsocial.com/social-media-benchmarks/tiktok
https://metricool.com/press-release-tiktok-study-2026/
https://www.quid.com/knowledge-hub/resource-library/blog/2026-social-media-industry-benchmark-report