TikTok Ad Click-Through Rate By Format 2026 [Benchmark Data]
TikTok’s blended ad click-through rate is 0.84%, but format changes that number by up to 19x. TopView placements reach 12%–16% CTR while standard In-Feed video sits at 1%–3%, based on 2025–2026 data from Triple Whale, Measured.com, and TikTok for Business. This post breaks down TikTok ad CTR by format, industry, and creative type using the most recent verified benchmarks.
TikTok Ad CTR By Format: Key Facts
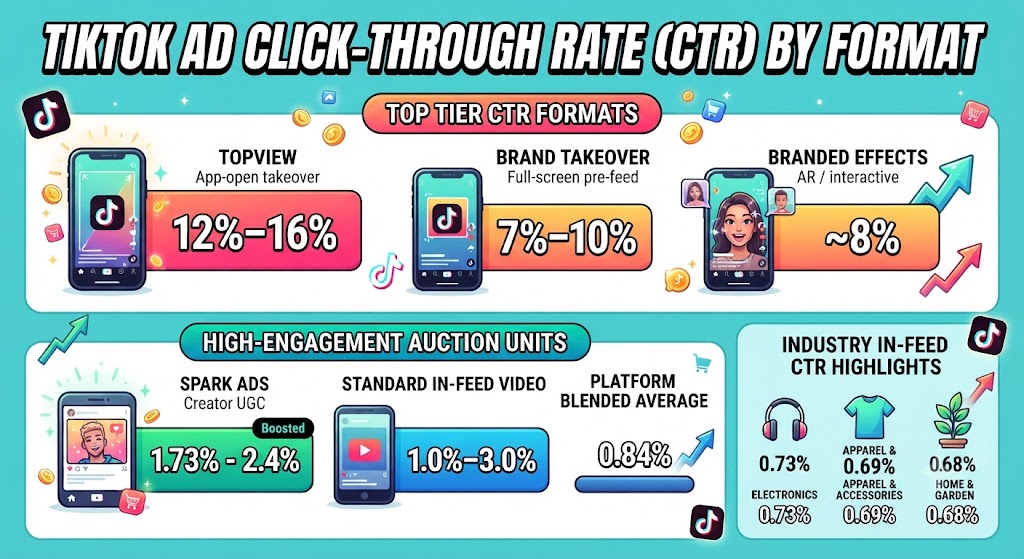
- TopView ads record 12%–16% CTR, the highest of any TikTok ad format, per Segwise and AdLibrary data.
- Spark Ads average 1.73% CTR across 1.3 million ad sets analyzed by Measured.com, double the 0.84% platform benchmark.
- Standard In-Feed video lands between 1.0% and 3.0% CTR in 2026 composites from DigitalApplied.
- TikTok CTR improved 13.74% year over year in 2025 while CPM rose 16% to $13.26, per Triple Whale.
- Product-tagged TikTok Shop ads convert at 3.7% against 1.8% for standard In-Feed, the widest format gap in the funnel.
The short version: reserved placements like TopView and Brand Takeover dominate raw CTR, Spark Ads beat studio In-Feed creative by 2x or more, and industry vertical shifts the auction baseline by up to 5x. The sections below cover each split with the underlying numbers.
TikTok Ad CTR By Format: 2026 Benchmark Table
Reserved placements that load before a user scrolls carry double-digit click rates. Auction units inside the feed cluster in the low single digits.
| Ad Format | Average / Range CTR | Placement Type |
|---|---|---|
| TopView | 12%–16% | App-open takeover (reserved) |
| Brand Takeover | 7%–10% | Full-screen pre-feed (reserved) |
| Branded Effects | ~8% | AR / interactive (reserved) |
| Spark Ads (creator UGC) | 2.4% | Auction / In-Feed |
| In-Feed video (standard) | 1.0%–3.0% | Auction / In-Feed |
| Platform blended average | 0.84% | All auction placements |
Source: Segwise, AdLibrary, DigitalApplied, WebFX
TopView loads full-screen the moment the app opens, which is why Segwise puts its CTR at 12%–16%, ahead of every other unit. Brand Takeover follows at 7%–10% for the same pre-feed reason.
DigitalApplied flagged a 16x CTR gap between TopView and In-Feed when modeling awareness spend. Reserved formats are booked at flat rates and optimize for reach, so their CTR is not directly comparable to auction units bidding for conversions.
The pricing behind these premium units scales with the platform’s overall ad business, tracked in the TikTok ad revenue statistics.
Spark Ads vs In-Feed Ads: CTR Comparison
Spark Ads boost an existing organic creator post instead of a studio asset. Every 2025–2026 dataset shows the creator format out-clicking standard In-Feed creative.
| Metric | Spark Ads | Standard In-Feed | Lift |
|---|---|---|---|
| Average CTR (Measured.com) | 1.73% | 0.84% platform avg | 2x |
| Average CTR (DigitalApplied) | 2.4% | 1.0% | 2.4x |
| Engagement rate (Socialbakers) | 6.1% | 2.5% | +142% |
| Conversion rate | 2.6% | 1.8% | +44% |
| Average CPC | $1.41 | $1.02 | +38% cost |
Source: Measured.com and Socialbakers via Amra & Elma, DigitalApplied, TikAdSuite
Measured.com analyzed 1.3 million TikTok ad sets and found Spark Ads averaged 1.73% CTR. Interactive Spark units with AI-generated CTA overlays reached 2.41% in consumer electronics and beauty.
Revel Interactive recorded a 64% CTR lift for Spark over non-Spark counterparts in head-to-head creative tests. A Socialbakers analysis of 310,000+ ad sets found Spark holding a 6.1% engagement rate against 2.5% for standard In-Feed.
The trade-off is cost. Spark CPC averages $1.41 against $1.02 for In-Feed per TikAdSuite, so the click advantage carries a 38% price premium. Creator content wins on clicks because users spend more time with native-feeling posts, a pattern quantified in the TikTok watch time per user data.
TikTok In-Feed CTR By Industry
Vertical shifts the auction baseline within the same format. Triple Whale’s full-year 2025 dataset covers January 1 through December 31, 2025 and gives the cleanest same-methodology read for e-commerce.
| Industry | Average In-Feed CTR |
|---|---|
| Electronics | 0.73% |
| Apparel & Accessories | 0.69% |
| Home & Garden | 0.68% |
| Pets & Animals | 0.49% |
Source: Triple Whale, full-year 2025
Electronics led every e-commerce vertical at 0.73%. Pets & Animals posted the lowest at 0.49%, a category where content earns emotional engagement but few shopping clicks.
Platform CTR improved 13.74% year over year in 2025 even as CPM rose 16% to $13.26 and CVR slipped to 2.01%, per Triple Whale. Audiences are clicking more; the clicks just cost more.
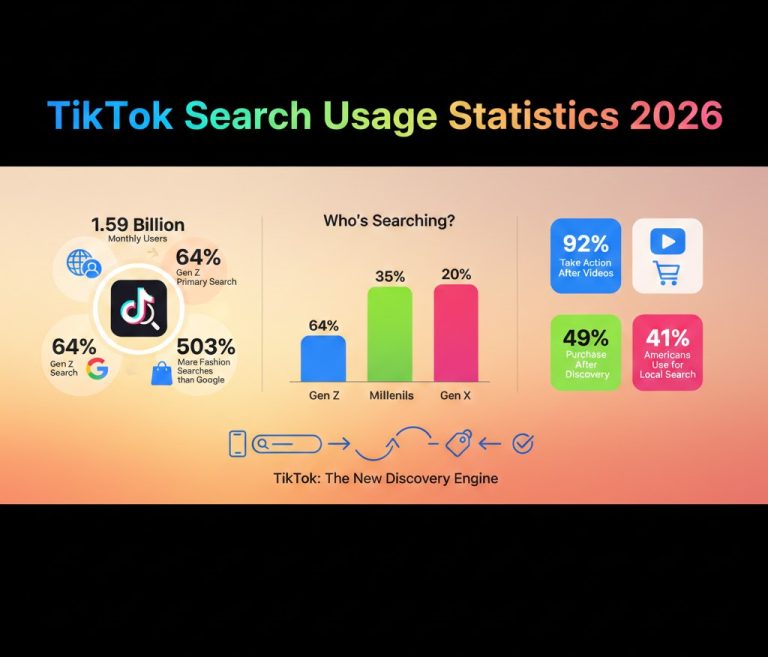
A separate 27-industry median dataset from TwoMinuteReports shows only three verticals clearing 1% CTR: Consumer Electronics at 2.59%, Transport at 1.62%, and Internet Finance at 1.36%. Most industries cluster between 0.40% and 0.60%, so benchmarking against the 0.84% blended figure says little. Click behavior also connects to how users find products on the platform, covered in the TikTok search usage numbers.
Carousel vs Video CTR On TikTok
Carousel is the swipeable multi-image unit. Its strongest published numbers come from TikTok’s own business data, so read them as directional.
| Format / Test | Reported Result | Baseline |
|---|---|---|
| Carousel (Vitamasques case) | 2x CTR of video | Standard video ad |
| Carousel (TikTok Business data) | +20%–30% CTR | Single-image ad |
| Carousel (US advertisers) | 0.5%–1.3% CTR | Creative-dependent range |
| TikTok Shop product-tagged ads | 3.7% CVR | 1.8% standard In-Feed CVR |
Source: TikTok for Business, Mega Digital, Bestever, TikAdSuite
In TikTok’s Vitamasques case study, Carousel delivered twice the CTR of video and roughly triple the CVR by fitting multiple SKUs into one swipeable unit. Aggregated TikTok Business data puts the typical Carousel lift at 20%–30% over single-image ads, with 15%–25% lower CPC.
Independent measurement runs lower. US advertisers generally see Carousel CTRs between 0.5% and 1.3% depending on creative, per Bestever and Lebesgue data.
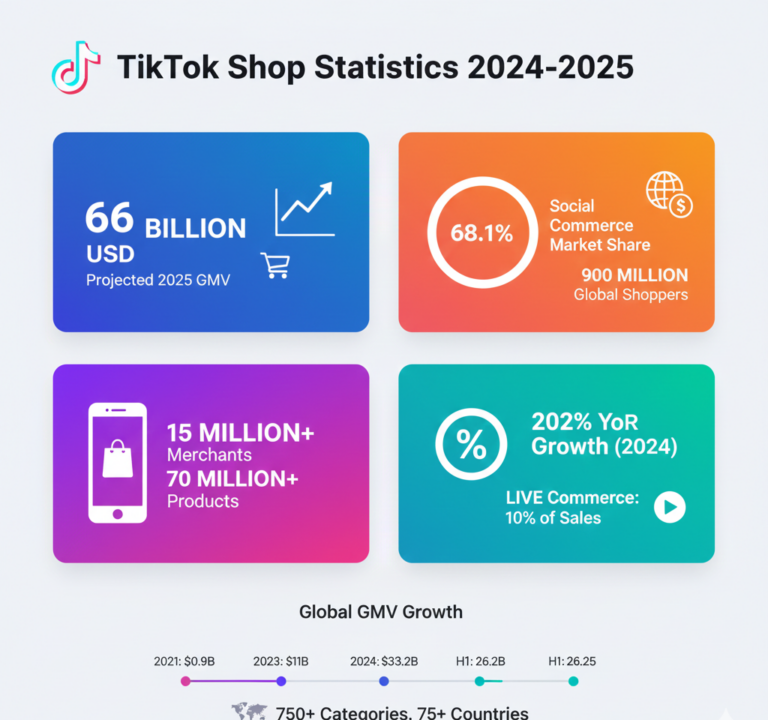
The sharpest gap sits at the conversion stage: product-tagged Shop ads convert at 3.7% against 1.8% for standard In-Feed, and Shop integration cut CPA 19% year over year in 2025. The commerce volume behind those numbers is broken out in the TikTok Shop statistics.
How To Read TikTok CTR-By-Format Data
Three caveats keep these benchmarks honest. Reserved formats optimize for reach at flat rates, so their 7%–16% CTRs cannot be judged against conversion-focused auction units, per AdBacklog.
TikTok Ads Manager reports both “Clicks (all)” and “Clicks (destination),” so two reports can quote different CTRs for the same campaign, a definition split Segwise documents in detail.
Roughly 30%–40% of TikTok conversions are view-through: the user sees the ad, skips the click, then searches the brand later, per GetKoro. CTR alone understates the platform’s full effect.
The practical read is simple. Benchmark against your format and your vertical, not the 0.84% blended average, and pair CTR with hook rate and conversion data before scaling spend.
FAQs
What is a good CTR for TikTok ads in 2026?
A good TikTok CTR is 1%+ for In-Feed auction ads, above the 0.84% platform average. Spark Ads should reach 1.7%–2.4%, while reserved TopView placements benchmark at 12%–16%.
Which TikTok ad format has the highest CTR?
TopView has the highest CTR at 12%–16%, per Segwise and AdLibrary. It loads full-screen when the app opens, before any scrolling, giving it more clicks than any auction-based format.
Do Spark Ads perform better than In-Feed ads?
Yes. Spark Ads average 1.73%–2.4% CTR versus 0.84%–1.0% for standard In-Feed, with 44% higher conversion rates. The trade-off is a higher CPC of $1.41 versus $1.02.
What is the average TikTok ad CTR by industry?
Electronics leads e-commerce at 0.73%, followed by Apparel at 0.69% and Home & Garden at 0.68%, per Triple Whale’s 2025 data. Pets & Animals sits lowest at 0.49%.
Did TikTok ad CTR improve in 2025?
Yes. TikTok CTR rose 13.74% year over year in 2025, per Triple Whale. Costs climbed alongside it: CPM increased 16% to $13.26 while CVR slipped to 2.01%.
Sources
https://www.triplewhale.com/blog/tiktok-benchmarks
https://www.webfx.com/blog/social-media/tiktok-benchmarks/
https://www.digitalapplied.com/blog/tiktok-ads-benchmarks-2026-cpc-cpm-cvr-industry