TikTok Live Shopping Conversion Rate 2026 (Latest Statistics)
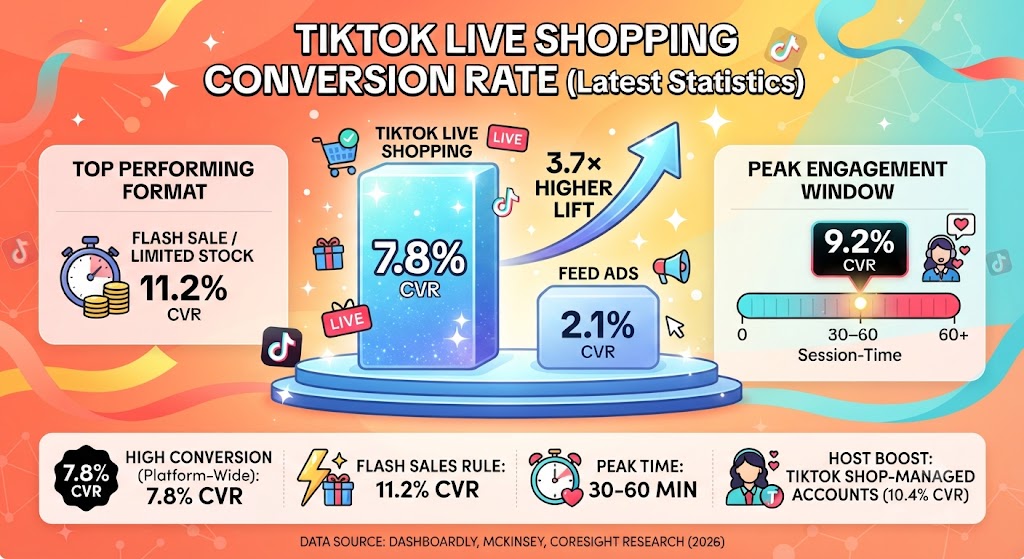
TikTok Live shopping converts at 7.8% in 2026, against 2.1% for feed ads — a 3.7× lift, based on Dashboardly’s April 2026 benchmarks. Live now drives 26% of US TikTok Shop GMV, up from 14% in 2024. This report covers conversion rates by session length, content format, host type, audience tier, and seasonality, with data from Dashboardly, McKinsey, eMarketer, and TikTok Newsroom.
TikTok Live Shopping Conversion Rate: Key Facts
- TikTok Live sessions convert at 7.8% overall, with a typical range of 5–12% depending on format and host (Dashboardly, April 2026).
- CVR peaks at 9.2% in the 30–60 minute window of a session, while AOV drops 16% to $26 in the same window.
- Flash sale streams convert at 11.2% — the highest of any format — versus 4.1% for challenge and entertainment streams.
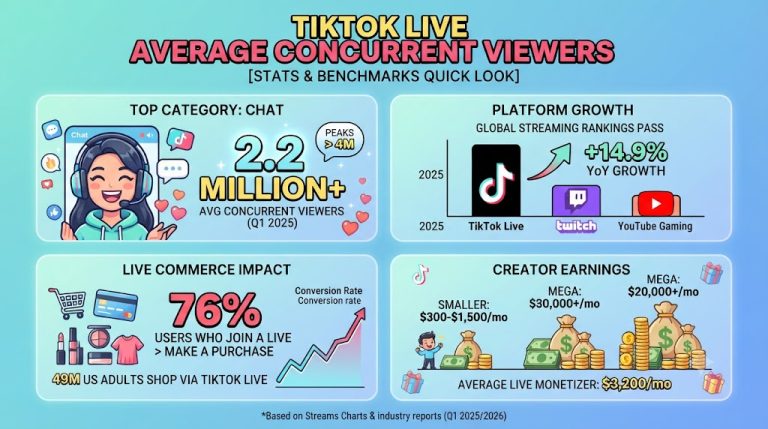
- 76% of livestream viewers who actively engaged with a stream made a purchase, per TikTok Newsroom via AMZScout.
- Live GMV on TikTok grew 86% year on year and now accounts for 26% of US TikTok Shop GMV.
The short version: the TikTok Live shopping conversion rate sits at 7.8% platform-wide in 2026, roughly triple what feed ads deliver. The rate moves with session length, format, and who hosts the stream — flash sales run by TikTok Shop-managed accounts hit double digits, while entertainment streams from brand accounts fall closer to 4%. The broader live commerce category converts at 9.5–15.2% across all platforms, per McKinsey and Coresight data cited by EasyApps.
How High Is the TikTok Live Shopping Conversion Rate in 2026?
Dashboardly puts the average Live CVR at 7.8% in 2026, drawing on TikTok LIVE analytics, Kalodata, and FastMoss. Feed ads convert at 2.1% on the same platform.
The all-platform live commerce average runs higher, at 9.5–15.2%, according to McKinsey 2025 and Coresight Research 2026 figures. Standard e-commerce pages convert at 1.8–2.5%, so live formats deliver a 6–10× advantage overall.
| Channel | Conversion Rate | Scope |
|---|---|---|
| TikTok Live shopping | 7.8% | TikTok, 2026 |
| TikTok feed ads | 2.1% | TikTok, 2026 |
| Live commerce (all platforms) | 9.5–15.2% | Global, 2025–2026 |
| Standard e-commerce | 1.8–2.5% | Global, 2025–2026 |
Source: Dashboardly, April 2026; McKinsey 2025 and Coresight Research 2026 via EasyApps Ecommerce
The gap between TikTok’s 7.8% and the broader 9.5–15.2% range comes down to measurement. Dedicated platforms like Bambuser and CommentSold often count only engaged viewers in the denominator, while TikTok counts every stream viewer, including passive scrollers. Creators building an audience for live selling can compare these numbers against TikTok session duration benchmarks to see how watch behavior feeds conversion.
TikTok Live Shopping Conversion Rate by Session Duration
CVR climbs through the first hour of a stream. It starts at 2.1% in the opening five minutes, reaches 7.8% by the 15–30 minute mark, and peaks at 9.2% between 30 and 60 minutes, per Dashboardly’s session-time data.
AOV moves the other way. Baseline order value of $29 falls to $26 during the CVR peak and to $24 in the 60–120 minute window, a 24% drop, as late buyers stack low-ticket impulse items.
| Session Window | Running CVR | Cumulative Orders | AOV | AOV vs Baseline |
|---|---|---|---|---|
| 0–5 min | 2.1% | ~50 | $29 | — |
| 5–15 min | 5.4% | ~240 | $31 | +7% |
| 15–30 min | 7.8% | ~510 | $29 | 0% |
| 30–60 min | 9.2% | ~780 | $26 | −16% |
| 60–120 min | 8.1% | ~1,050 | $24 | −24% |
Source: Dashboardly, April 2026, citing TikTok LIVE analytics, Kalodata, FastMoss
A seller chasing revenue per order should sell hardest in the 15–30 minute window, where CVR hits 7.8% with AOV still at $29. A seller chasing volume runs 120-minute sessions and accepts the $24 AOV. One session cannot maximize both, which is why some sellers run short premium streams for high-ticket items and long streams for SKU-heavy catalogs on different nights.
Which Live Content Formats Convert Best on TikTok?
Flash sales with limited stock convert at 11.2%, the top format in Dashboardly’s 2024–2025 data. Challenge and entertainment streams sit last at 4.1% despite holding viewers for 34 minutes — 89% longer than flash sales.
| Format | Avg CVR | Avg Watch Time | Best Categories |
|---|---|---|---|
| Flash sale / limited stock | 11.2% | 18 min | Beauty, fashion, accessories |
| Product demo + Q&A | 8.4% | 24 min | Beauty, home, electronics |
| Unboxing / reveal | 7.2% | 19 min | Beauty, electronics, fashion |
| Tutorial + sell | 6.8% | 28 min | Beauty, cooking, crafts |
| Challenge / entertainment | 4.1% | 34 min | Fashion, wellness, fitness |
Source: Dashboardly, April 2026
The flash-vs-entertainment gap works out to 7.1 percentage points, or 2.7× more conversions per viewer. Across all live platforms, limited-time offers convert at 18–22% and product demos at 12–16%, per McKinsey, Coresight, and Bambuser data. Tutorial-style streams hold attention longest outside entertainment at 28 minutes, a pattern that matches what educational content engagement data on TikTok shows for recorded video too.
TikTok Live Shopping Conversion Rate by Host Type
Who runs the stream changes the outcome. Brand-only streams convert at 6.2% and average $1,800 per session. TikTok Shop-managed streams, an invitation-only program, convert at 10.4% and average $12,000 per session.
Affiliate creators sit in the middle at 8.4% CVR and $2,900 per stream, yet they generate 42% of all Live GMV — the largest share of any host type. Volume explains it: affiliates run more sessions with larger engaged audiences, so frequency multiplied by moderate revenue beats per-session efficiency.
| Host Type | CVR | Avg Stream Revenue | Share of Live GMV |
|---|---|---|---|
| Brand-owned | 6.2% | $1,800 | 28% |
| Affiliate creator | 8.4% | $2,900 | 42% |
| Co-hosted (brand + creator) | 9.8% | $5,600 | 18% |
| TikTok Shop-managed | 10.4% | $12,000 | 12% |
Source: Dashboardly, April 2026
The spread between the weakest and strongest host type is 4.2 percentage points. Creators weighing the affiliate route can model their per-stream income against follower size with a TikTok money calculator before committing to a live schedule.
How Much Revenue Do Live Sellers Make Per Stream?
Revenue scales hard with audience size. Hobby streams under 100 viewers average $120 per session, while mega streams over 50,000 viewers average $48,000 — a 400× range, per Dashboardly.
| Audience Tier | Viewers | Avg Revenue per Stream |
|---|---|---|
| Hobby | Under 100 | $120 |
| Small | 100–1K | $800 |
| Mid | 1K–10K | $5,200 |
| Large | 10K–50K | $18,000 |
| Mega | 50K+ | $48,000 |
Source: Dashboardly, April 2026
The jump from Small to Mid tier — $800 to $5,200, a 550% increase — is where unit economics turn favorable. A Mid-tier seller running 10 streams a week can reach $52,000 in weekly GMV. Getting there typically takes 5+ streams per week for four to six months, and successful Live sellers work 15–25 stream hours weekly, a workload documented in TikTok creator burnout statistics. Sellers still building toward the 1K-viewer threshold usually start with follower growth tactics before scaling stream frequency.
Seasonality: When Does the Live Conversion Engine Peak?
Q4 Live GMV runs at 1.8× baseline, nearly double a normal quarter. Q1 is the slowest at 0.85× baseline, with Valentine’s week (1.4×) and the Amazon Prime Day shadow week (1.15×) as secondary peaks.
| Period | Live GMV vs Baseline |
|---|---|
| Q1 | 0.85× |
| Valentine’s week | 1.4× |
| Prime Day shadow week | 1.15× |
| Q4 | 1.8× |
Source: Dashboardly, April 2026
Black Friday–Cyber Monday 2025 recorded 760,000+ livestream sessions and 1.6 billion views on TikTok Shop, up 84% year on year, per Ringly. Insider Intelligence projects that livestream flash sales will account for 54% of total BFCM holiday transactions in 2026, with watch time during purchase events up 112% versus BFCM 2024, via Amra & Elma. Sellers preparing for Q4 often pair stream scheduling with posting frequency data to keep the algorithm feeding new viewers into streams.
Live Shopping vs Standard E-Commerce: Returns and Market Size
Live purchases come back at 8–12%, versus 20–30% for standard e-commerce — a 40–60% reduction, based on McKinsey 2025 data via EasyApps. A buyer who watches a product demonstrated in real time makes a better-informed decision than one buying from a static image.
The US live commerce market reached $42 billion in 2026 and is growing at 36% CAGR through 2028, per eMarketer. China’s market exceeds $500 billion (iResearch), putting the US at roughly 8.4% of China’s scale. Live commerce is 5.2% of total US e-commerce in 2026, up from 3.1% in 2024.
| Metric | Figure | Source |
|---|---|---|
| Live purchase return rate | 8–12% | McKinsey 2025 |
| Standard e-commerce return rate | 20–30% | McKinsey 2025 |
| Viewers who return for later events | 62% | CommentSold 2025 |
| Viewers who share a live event | 18% | TikTok 2025 |
| US shoppers who have bought via livestream | 12% (another 12% plan to) | Ringly, June 2026 |
| US live shopping events per day | 45,000+ (up from 18,000 in 2024) | Coresight Research 2026 |
Source: EasyApps Ecommerce, April 2026; Ringly, June 2026
Only 12% of US shoppers have bought through a livestream, and another 12% plan to, which leaves most of the market untapped. The 62% return-viewer rate matters because repeat viewers convert at higher rates once trust is established — the same compounding effect behind view growth strategies on the recorded side of the platform.
FAQs
What is the average TikTok Live shopping conversion rate?
7.8% in 2026, according to Dashboardly, with a typical range of 5–12%. That is 3.7× higher than TikTok feed ads, which convert at 2.1%.
Which live format converts best on TikTok?
Flash sales with limited stock convert at 11.2%, the highest of any format. Product demos with Q&A follow at 8.4%, while entertainment streams convert lowest at 4.1%.
How long should a TikTok Live selling session be?
CVR peaks at 9.2% between 30 and 60 minutes. Sessions of 15–30 minutes protect AOV at $29, while 120-minute sessions maximize order volume at a lower $24 AOV.
How much do TikTok Live sellers earn per stream?
From $120 per stream at under 100 viewers to $48,000 at 50,000+ viewers. Mid-tier sellers (1K–10K viewers) average $5,200 per stream, per Dashboardly.
Do live shopping purchases get returned less often?
Yes. Live purchases return at 8–12% versus 20–30% for standard e-commerce, a 40–60% reduction, based on McKinsey 2025 data. Real-time demos narrow the expectation gap.
Sources
https://www.dashboardly.io/statistics/tiktok-shop-live-shopping-statistics
https://easyappsecom.com/guides/shopify-live-shopping-statistics-2026