TikTok Micro-Influencer Engagement Rate Statistics 2026
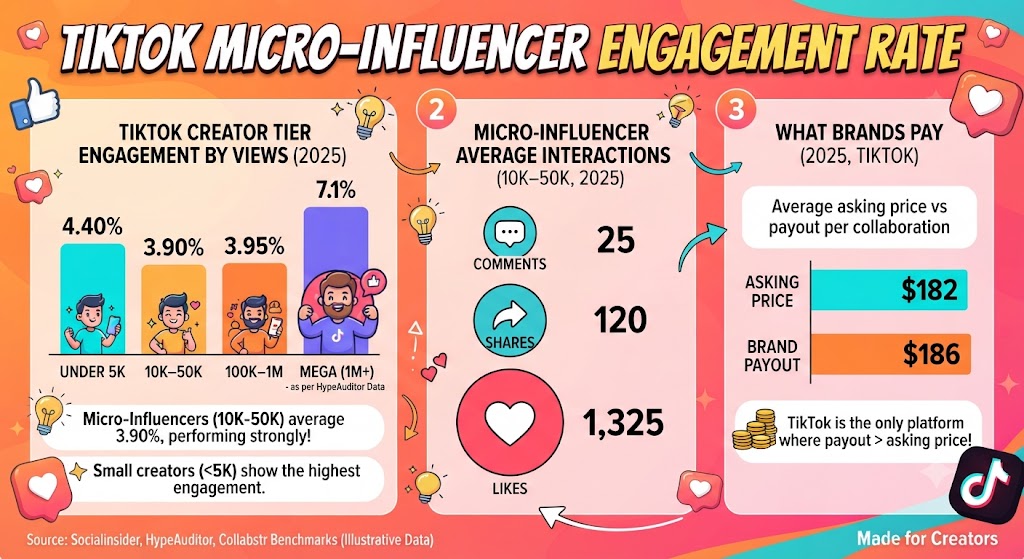
TikTok accounts holding 10,000 to 50,000 followers averaged 3.90% engagement by views in 2025, behind the 4.40% recorded by accounts under 5,000 followers. That comes from Socialinsider’s analysis of 2 million videos across 214,507 profiles. This post breaks the number down by tier, by interaction type, and by the measurement method that decides whether a creator’s rate reads as 2% or 8.7%.
TikTok Micro-Influencer Engagement Rate
TikTok Micro-Influencer Engagement Rate by Follower Tier
Socialinsider calculates engagement by views: likes, comments, shares and saves divided by views. The 10,000 to 50,000 band rose from 3.80% to 3.90% between 2024 and 2025.
Accounts under 5,000 followers gained twice as much over the same period. Two tiers registered no movement at all.
| Page size | 2024 | 2025 | Change |
|---|---|---|---|
| 1K–5K | 4.20% | 4.40% | +0.20 pp |
| 5K–10K | 3.85% | 4.00% | +0.15 pp |
| 10K–50K | 3.80% | 3.90% | +0.10 pp |
| 50K–100K | 3.75% | 3.75% | No change |
| 100K–1M | 3.95% | 3.95% | No change |
Source: Socialinsider 2026 TikTok Benchmarks, engagement rate by views, January 2024 – December 2025
The curve is not clean. Accounts in the 100K–1M band sat at 3.95%, above both the micro tier and the 50K–100K tier.
Platform-wide, engagement by views moved from 3.85% to 4.20%, a 9% year-over-year rise reported by Socialinsider. Micro creators improved more slowly than TikTok as a whole. A closer look at engagement rate by follower count shows how differently the same accounts score under a follower-based formula.
How Does the TikTok Micro-Influencer Engagement Rate Compare to Nano and Mega Creators?
HypeAuditor draws on a separate dataset of 104 million TikTok accounts, and its figures run several points above Socialinsider’s. Within that dataset, micro creators sat 1.6 points below nano and 1.6 points above mega.
HypeAuditor published creator-base shares for the two smallest tiers only.
| Tier | Followers | Engagement rate | Share of creators |
|---|---|---|---|
| Nano | 1K–10K | 10.3% | 87.7% |
| Micro | 10K–50K | 8.7% | 8% |
| Mid-tier | 50K–500K | 7.5% | Not reported |
| Mega | 1M+ | 7.1% | Not reported |
Source: HypeAuditor State of Influencer Marketing 2025, 2024 data, 104 million TikTok accounts
Instagram shows nothing like that spacing. Nano creators there recorded 2.19% in the same report, and 76% of Instagram influencers fall in the nano band.
Likes, Comments and Shares Behind the TikTok Micro-Influencer Engagement Rate
Shares moved fastest inside the micro range. Accounts at 10K–50K went from 95 shares per video in 2024 to 120 in 2025, while the 50K–100K band climbed from 135 to 200.
Comments barely moved. The micro tier went from 23 to 25 per video, and likes rose from 1,225 to 1,325.
| Page size | Likes | Comments | Shares |
|---|---|---|---|
| 1K–5K | 330 | 8 | 40 |
| 5K–10K | 595 | 15 | 60 |
| 10K–50K | 1,325 | 25 | 120 |
| 50K–100K | 2,675 | 40 | 200 |
| 100K–1M | 7,900 | 100 | 477 |
Source: Socialinsider 2026 TikTok Benchmarks, average interactions per post, 2025
Shares Per Post, 2024 vs 2025
Socialinsider aggregates per-post interaction averages separately from tier engagement rates. The two sets are not built to be divided into each other.
Average views per post fell for the micro band, from 3,655 to 3,240, while the 50K–100K tier rose from 8,688 to 9,900. Retention drives much of that gap, and how far viewers get through a video varies widely inside a single tier.
Why TikTok Micro-Influencer Engagement Rate Benchmarks Disagree
Four credible studies produce a spread from 2% to 8.7% for creators of broadly similar size. The rows below are not comparable with each other, because each divides interactions by something different.
| Source | What it measures | Period | Figure |
|---|---|---|---|
| Socialinsider | Interactions ÷ views, 10K–50K accounts | 2025 | 3.90% |
| Socialinsider | Interactions ÷ views, platform-wide | H1 2026 | 3.85% |
| Socialinsider | Interactions ÷ followers, platform-wide | H1 2026 | 2.70% |
| HypeAuditor | Average engagement rate, micro tier | 2024 | 8.7% |
| Collabstr | Engagement on TikTok video deliverables | 2025 | 2% |
Sources: Socialinsider 2026 TikTok Benchmarks and 2026 Social Media Benchmarks; HypeAuditor State of Influencer Marketing 2025; Collabstr Annual Influencer Marketing Report 2026
Socialinsider’s follower-based reading fell to 2.70% in the first half of 2026, which the company describes as its lowest in a year and a half. Its view-based reading held between 4.20% and 4.30% for five consecutive quarters through Q1 2026, then dropped to 3.85% in Q2 2026.
Follower counts and view counts have come apart on a feed built around recommendations. Any rate quoted without its denominator is unusable in a negotiation, which also applies to figures drawn from search behaviour on the app.
Collabstr’s 2% covers sponsored deliverables. In the same ranking, YouTube videos led at 6%, Instagram Reels reached 5% and YouTube Shorts 4.5%.
What Brands Pay TikTok Micro Creators
Collabstr analysed 472,000 packages and 21,000 collaborations from 2025. TikTok is the only platform in its list where the average payout landed above the average asking price.
| Platform | Average asking price | Average payout |
|---|---|---|
| Twitch | $398 | $127 |
| YouTube | $311 | $255 |
| $214 | $193 | |
| Amazon | $193 | $88 |
| TikTok | $182 | $186 |
| UGC | $180 | $154 |
| X (Twitter) | $179 | $76 |
Source: Collabstr Annual Influencer Marketing Report 2026, 2025 collaborations
Nearly 80% of collaborations closed under $300. Another 18% landed between $301 and $1,000, and 2% went above $1,000.
TikTok’s share of campaigns on the platform halved, falling from 41% to 21% across 2025. Collabstr attributes the drop partly to uncertainty following the 2024 US divestiture law rather than to engagement performance. Rate expectations across tiers sit further apart than these averages suggest, as the spread in what creators actually earn shows.
Share of Collaborations by Platform, 2025
Reach and Volume Pressure on TikTok Creators
Metricool compared 2,314,756 TikTok posts from more than 92,000 accounts across January–February 2025 and January–February 2026. Per-post performance fell across every headline metric while publishing volume climbed.
Interactions and views declined at almost the same rate, which is why engagement by views looks steady while absolute numbers drop by roughly a third.
| Metric | Year-over-year change |
|---|---|
| Videos published | +72.10% |
| Image and carousel posts published | +140% |
| Views per post | −31.30% |
| Reach per post | −28.73% |
| Interactions per post | −31.17% |
Source: Metricool 2026 TikTok Study, January–February 2025 vs January–February 2026
The For You feed still delivered 72.70% of video views. Metricool also found that 16.47% of TikTok accounts moved into a higher follower category, ahead of Instagram, LinkedIn, YouTube, Facebook, X and Pinterest.
Posts collected 96% of their total reach and close to 98% of their interactions within ten days. Videos generated five times the reach and six times the interactions of images or carousels, a gap that also turns up in how educational content performs.
Volume alone no longer moves the number. Micro accounts raised output from 9 to 16 posts per month between 2024 and 2025 while their follower growth rate fell from 86% to 60%, which lines up with what the data on posting cadence and wider TikTok marketing figures shows.
Conversion is where the micro tier now gets judged. Engagement is the leading indicator, and TikTok Shop affiliate performance is the one brands price against.
FAQs
What is a good TikTok micro-influencer engagement rate?
Socialinsider put accounts with 10,000 to 50,000 followers at 3.90% engagement by views in 2025. Anything above that beats the tier benchmark, provided the rate is measured against views rather than followers.
Do micro creators outperform larger TikTok accounts?
Not consistently. In Socialinsider’s 2025 data the 10K–50K tier reached 3.90% while the 100K–1M tier reached 3.95%. HypeAuditor’s separate dataset shows micro at 8.7% against 7.1% for mega.
Do the engagement rates creators share on Reddit match these benchmarks?
Reddit figures are self-reported and rarely state a denominator, so they scatter widely. Published datasets give a range of 2% to 8.7% for similar accounts depending entirely on the measurement method used.
Is Reddit a reliable source for TikTok collaboration rates?
Reddit threads capture individual deals, not market averages. Collabstr’s analysis of 21,000 collaborations puts the average TikTok payout at $186, with nearly 80% of all deals closing under $300.
Why did TikTok engagement rates drop in 2026?
Socialinsider recorded engagement by views falling to 3.85% in Q2 2026 after five stable quarters. Metricool found views per post down 31.30% year over year while video publishing rose 72.10%.
Sources
https://www.socialinsider.io/social-media-benchmarks/tiktok
https://hypeauditor.com/state-of-influencer-marketing-2025/