TikTok Sponsored Post vs Organic Engagement Statistics 2026
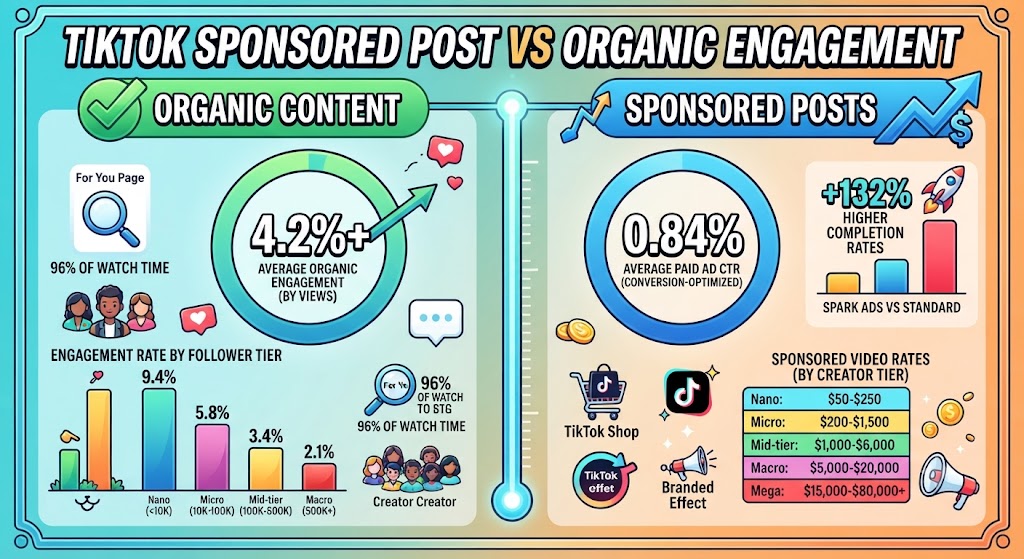
TikTok’s organic engagement rate reached 4.20% by views in Q1 2026, based on Socialinsider’s analysis of 2 million posts, while conversion-optimized paid ads average a 0.84% CTR. Sponsored creator posts earn less organic engagement than unsponsored content from the same accounts. This post covers organic benchmarks, sponsored post performance, Spark Ads data, paid ad costs, and creator pricing for 2026.
TikTok Sponsored Post vs Organic Engagement Statistics: Key Facts
- TikTok organic engagement sits at 4.20% by views in Q1 2026, up 9% from 3.85% in 2024 (Socialinsider).
- Conversion-optimized TikTok ads average 0.84% CTR (Lebesgue benchmark data).
- Spark Ads deliver 132% higher completion rates than standard in-feed ads (Flighted, April 2026).
- Nano accounts under 10K followers record 9.4% engagement; macro accounts above 500K drop to 2.1% (Bravery Technology).
- 96% of all TikTok watch time comes from the For You Page, not followed accounts (Flighted; SQ Magazine).
The core comparison: sponsored creator posts on TikTok carry a measurable organic engagement discount against unsponsored posts from the same creator, per InfluencerFee’s May 2026 data. Brands that amplify those sponsored posts through Spark Ads recover the gap and often exceed organic-only totals. Organic rates of 4.07% to 5.7% and the 0.84% paid CTR measure different things, since one counts all interactions per view and the other counts clicks per impression, but the spread shows how differently earned and bought attention behave on the platform.
How High Is TikTok Organic Engagement in 2026?
Socialinsider recorded 4.20% engagement by views in Q1 2026 from a dataset of 2 million videos across 214,507 profiles. Brandwatch’s 2025 figure, cited by Dataslayer, comes in at 4.07% by impressions, while OwlClaw cites a 5.7% platform average from Socialinsider’s 2025 data.
The 4.07% to 5.7% range reflects different denominators, not conflicting facts. Per-view calculations run lower; per-follower calculations run higher.
| Platform | Organic Engagement Rate | Gap vs TikTok |
|---|---|---|
| TikTok | 4.2% | — |
| Instagram Reels | 2.8% | 1.5x lower |
| YouTube Shorts | 1.9% | 2.2x lower |
| Instagram (overall) | 1.22% | 3.4x lower |
| 0.09–0.6% | 7–47x lower |
Source: Bravery Technology, April 2026; Dataslayer citing Brandwatch 2025; OwlClaw, May 2026
TikTok posts reach 15–25% of a brand’s followers on average, against Instagram’s 6–9%, per Bravery Technology. OwlClaw puts a good TikTok engagement rate at 6–9%, above the platform average.
TikTok Organic Engagement Rate by Account Size
Engagement drops as follower count grows. Nano accounts under 10K followers hit 9.4%, while macro accounts above 500K record 2.1%, a 7.3 percentage point spread based on Bravery Technology’s April 2026 figures.
| Account Tier | Followers | Engagement Rate |
|---|---|---|
| Nano | Under 10K | 9.4% |
| Micro | 10K–100K | 5.8% |
| Mid-tier | 100K–500K | 3.4% |
| Macro | 500K+ | 2.1% |
Source: Bravery Technology, April 2026
The mechanism is the For You Page. Mid-tier creators get 70–90% of their post views from non-followers, per InfluencerFee, so smaller accounts register each interaction against a smaller denominator. A deeper breakdown sits in this analysis of TikTok engagement rates across follower tiers.
Brands comparing engagement rate across tiers are not comparing like for like. A nano at 9.4% and a macro at 2.1% can represent similar absolute engagement counts at very different cost-per-engagement profiles.
Do Sponsored Posts Get Less Engagement Than Organic TikTok Content?
Yes, on organic reach metrics. Sponsored posts from creators typically underperform their unsponsored posts, an engagement discount that reflects audience sensitivity to overt commercial content, per InfluencerFee’s May 2026 report.
Spark Ads change the outcome. When brands put paid distribution behind a creator’s sponsored post, total engagement often exceeds what organic-only sponsored content achieves.
| Spark Ads Metric | Figure | Source |
|---|---|---|
| Completion rate vs standard in-feed ads | +132% | Flighted, April 2026 |
| CTR vs brand-originated in-feed ads | +30–60% | InfluencerFee, May 2026 |
| UK advertiser adoption as primary format | 62% (from 34% in 2024) | Bravery Technology |
| UK Spark Ads CPM | £3.90 (cheapest format) | Bravery Technology |
Source: Flighted, April 2026; InfluencerFee, May 2026; Bravery Technology, April 2026
UK adoption jumped 28 percentage points in a year, from 34% to 62% of advertisers using Spark Ads as their primary format. Completion behavior drives much of this, and the pattern matches broader TikTok video completion rate data showing shorter, native-feeling content retains viewers longest.
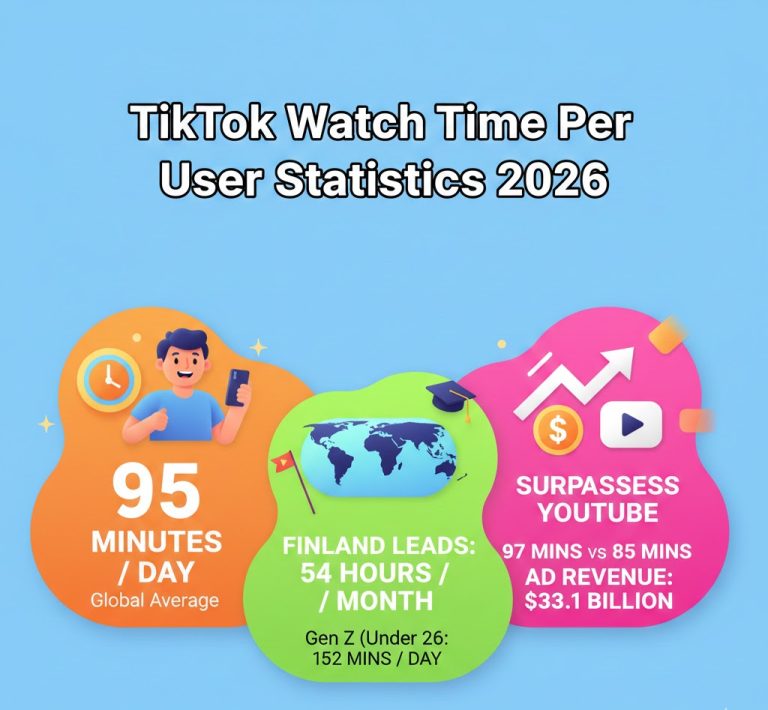
The For You Page underpins the whole equation. It accounts for 96% of watch time, which also explains the app’s lead in daily watch time per user over YouTube and Instagram.
TikTok Paid Ads: CTR, CPM, and Conversion Benchmarks
Conversion-optimized in-feed ads average 0.84% CTR, per Lebesgue data cited by Dataslayer and WebFX. Premium placements run far higher: TopView reaches 12–16%, Branded Effects about 8%, and standard In-Feed about 5%, based on WebFX’s May 2026 benchmarks.
Triple Whale’s DTC dataset shows CTR improved 13.74% in 2025 while conversion rate fell 6.20% to 2.01%. Users click more and buy less after clicking, which points to a landing-page problem rather than an ad problem.
| Metric | 2025 Figure | YoY Change |
|---|---|---|
| CPM (DTC brands) | $13.26 | +16% |
| CPA | $32.74 | +8.64% |
| CVR (DTC e-commerce) | 2.01% | −6.20% |
| ROAS (platform reported) | 2.21 | −5.70% |
| CTR | Improved | +13.74% |
Source: Triple Whale, March 2026
TikTok’s cost advantage over Meta is closing. TikTok was 50%+ cheaper on CPM in 2023; by 2025 the gap sat under 10%, with TikTok at $13.26 against Meta’s $14.19 in Triple Whale’s data.
Global averages run lower than the DTC dataset: $8.30 mid-2025 per Marketing LTB and $9.16 for 2026 per WebFX. UK advertisers pay £4.80 CPM on TikTok versus £6.20 on Instagram.
Digital Applied reports 4.2x ROAS on e-commerce objectives and a 47% lower CPA than comparable Instagram campaigns. That CPA figure uses platform-level audience comparisons, not Triple Whale’s DTC-only dataset, which is why both can hold at once.
TikTok Sponsored Post Rates by Creator Tier in 2026
Sponsored video pricing scales with follower count. Nano creators charge $50–$250 per video while mega creators above 2M followers command $15,000–$80,000+, per InfluencerFee’s May 2026 rate data.
| Creator Tier | Followers | Rate per Sponsored Video |
|---|---|---|
| Nano | 1K–10K | $50–$250 |
| Micro | 10K–100K | $200–$1,500 |
| Mid-tier | 100K–500K | $1,000–$6,000 |
| Macro | 500K–2M | $5,000–$20,000 |
| Mega | 2M+ | $15,000–$80,000+ |
Source: InfluencerFee, May 2026
Spark Ads licensing adds $25–$8,000 on top of the creation fee depending on tier and license duration. TikTok influencer budgets grew 30–45% year over year against a 15–20% industry average, and the platform now takes 25–35% of total influencer spend.
Conversion closes the loop. TikTok Shop affiliate content converts 3–8% of engaging viewers in beauty and food, against 0.5–2% for Instagram link-in-bio, a 3–6x gap that tracks with the platform’s wider TikTok Shop transaction growth.
Ad Fatigue and Attribution on Sponsored TikTok Content
Conversion rates drop 30–40% once ad frequency passes 2.5x, per Flighted. Fatigue arrives 4x faster on TikTok than on Facebook, so paid creative needs refreshing every 2–4 weeks.
A first-time impression rate below 50–60% signals audience saturation. UGC and creator-made content outperform polished brand creative for both awareness and conversion, according to Marketing LTB, a pattern consistent with how TikTok users act on content they discover.
Attribution shifts the ROAS picture. TikTok’s engaged-view model counts a conversion when someone watches 6+ seconds and buys within 1–7 days, recapturing 30–40% of conversions that last-click models assign elsewhere, per Dataslayer citing TikTok documentation.
FAQs
Do sponsored TikTok posts get less engagement than organic posts?
Yes. Sponsored creator posts typically earn less organic engagement than unsponsored posts from the same account, per InfluencerFee 2026 data. Spark Ads amplification compensates and often produces higher total engagement than organic-only sponsored content.
What is TikTok’s average organic engagement rate in 2026?
4.20% by views in Q1 2026, per Socialinsider, up 9% from 3.85% in 2024. Other sources report 4.07% to 5.7% depending on whether views, impressions, or followers form the denominator.
How much do TikTok Spark Ads outperform standard in-feed ads?
Spark Ads deliver 132% higher completion rates and 30–60% higher CTR than brand-originated in-feed ads. In the UK, 62% of advertisers now use Spark Ads as their primary format, up from 34% in 2024.
How much does a sponsored TikTok post cost in 2026?
Nano creators charge $50–$250 per video, micro $200–$1,500, mid-tier $1,000–$6,000, macro $5,000–$20,000, and mega creators $15,000–$80,000+. Spark Ads licensing adds $25–$8,000, per InfluencerFee.
What is TikTok’s average paid ad CTR and CPM?
Conversion-optimized ads average 0.84% CTR. CPM runs $8.30–$9.16 globally and $13.26 for DTC brands in Triple Whale’s 2025 dataset. TopView placements reach 12–16% CTR at higher CPMs.
Citations
https://www.socialinsider.io/social-media-benchmarks/tiktok