TikTok Verified Account Engagement Rate Statistics 2026
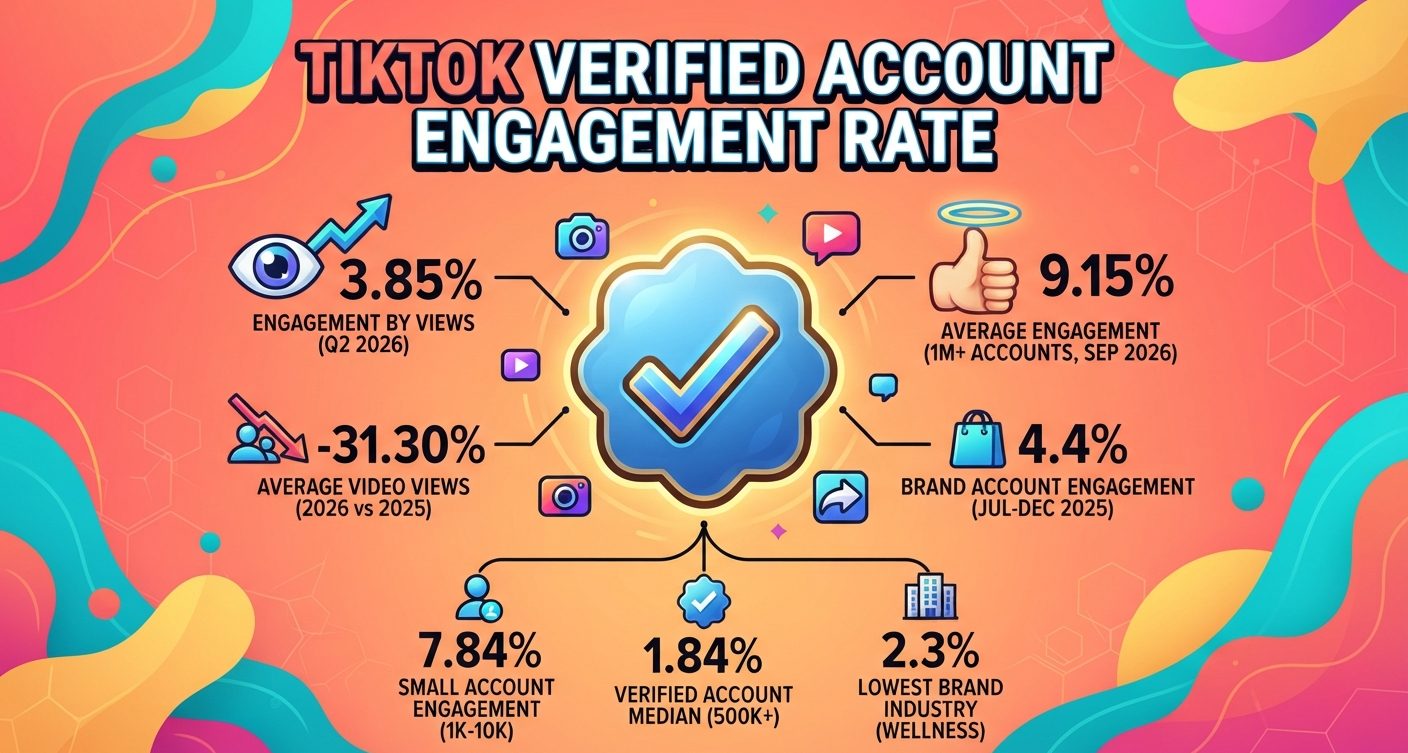
TikTok accounts above 500,000 followers post a 1.84% median engagement rate when interactions are divided by followers. Accounts above 1 million post a 9.15% average when interactions are divided by views.
That spread shapes any TikTok verified account engagement rate benchmark, because TikTok grants badges without a follower threshold and no published dataset splits engagement by badge. This page sets top-tier, brand, and reach data from 2025 and 2026 side by side.
TikTok Verified Account Engagement Rate
Does the Blue Check Change a TikTok Verified Account Engagement Rate?
No published TikTok data answers that directly. TikTok’s help centre says a badge confirms an account belongs to the person or brand it represents.
TikTok also states it does not treat follower or like counts as a requirement. Review rests on five account checks.
| Requirement | What TikTok checks |
|---|---|
| Active | Logged in within the past 6 months |
| Authentic | Represents a real person, business, or entity; one badge per person or business, except language-specific accounts |
| Complete | Public account with a bio, name, profile photo, and at least one video |
| Notable | Featured in multiple news sources; press releases and sponsored or paid media do not count |
| Secure | Multi-factor authentication with a verified email |
Source: TikTok Support, Verified accounts on TikTok, accessed September 2026
Verification is free, and TikTok says a badge does not imply endorsement.
Is There Verified vs Unverified Engagement Data?
Not for TikTok. The closest split is HypeAuditor’s February 2020 Instagram study of 6.5 million accounts with more than 1,000 followers.
It found 3.26% of those accounts verified, 73.5% of 1M+ accounts verified, and 30% higher average engagement for verified accounts. Those figures describe Instagram in 2020, not TikTok.
Source: HypeAuditor, Instagram verification study, published 6 February 2020
Million-follower accounts are also a small slice of what users follow. Pew Research Center found 10% of creator accounts followed by U.S. adults on TikTok have more than 1 million followers, while 42% have 50,000 to 499,999.
Source: Pew Research Center, What we know about TikTok content creators, February 2025
1.84% at 500K+: TikTok Verified Account Engagement Rate by Followers
SociaVault Labs measured 150,000 TikTok accounts from 1 February to 15 March 2026. Each rate divides likes, comments, and shares by followers across an account’s last 30 posts.
The 500K+ tier recorded a 1.84% median. Its 75th percentile, 2.89%, sits below the 1K–10K tier’s 25th percentile of 4.92%.
| Follower tier | 25th percentile | Median | 75th percentile |
|---|---|---|---|
| 1K–10K | 4.92% | 7.84% | 12.31% |
| 10K–50K | 3.28% | 5.21% | 8.14% |
| 50K–100K | 2.47% | 3.89% | 6.02% |
| 100K–500K | 1.71% | 2.73% | 4.22% |
| 500K+ | 1.12% | 1.84% | 2.89% |
Source: SociaVault Labs, Engagement Rate Benchmarks 2026, 150,000 TikTok accounts, 1 Feb–15 Mar 2026
The study’s all-tier TikTok median moved from 5.10% in 2024 to 4.62% in 2025 and 4.25% in 2026. Older third-party engagement figures by follower count use different samples and tier cut-offs.
TikTok Verified Account Engagement Rate by Views, 1M+ Tier
TokPortal divides likes, comments, and shares by views across each profile’s last 12 posts, with 1,000 profiles per tier. Its 27 September 2026 update puts the 1M+ tier at a 9.15% average and an 8.4% median.
The rate bottoms at 100K–1M, with a 7.83% average, then rises above 1 million. Accounts in the 1M+ tier averaged 4.3 million views per post, a scale that also reshapes comment-to-view ratios.
| Follower tier | Average | Median | Top 25% |
|---|---|---|---|
| 100–1K | 10.41% | 7.61% | 12.63% |
| 1K–10K | 10.64% | 7.91% | 13.56% |
| 10K–100K | 8.21% | 6.26% | 10.95% |
| 100K–1M | 7.83% | 7% | 10.63% |
| 1M+ | 9.15% | 8.4% | 12.11% |
Source: TokPortal Engagement Benchmark Index, 5,000 profiles, updated 27 September 2026
The index refreshes daily from profiles TokPortal has analysed, so readings shift between visits. It is not a platform-wide crawl.
How Socialinsider’s 100K–1M Band Compares
Socialinsider adds saves to likes, comments, and shares, then divides by views. Its largest band, 100K–1M, held at 3.95% in both 2024 and 2025.
| Page size | 2024 | 2025 |
|---|---|---|
| 1K–5K | 4.20% | 4.40% |
| 5K–10K | 3.85% | 4.00% |
| 10K–50K | 3.80% | 3.90% |
| 50K–100K | 3.75% | 3.75% |
| 100K–1M | 3.95% | 3.95% |
Source: Socialinsider, 2026 TikTok Benchmarks, 2M videos from 214,507 profiles, Jan 2024–Dec 2025
The low point in both years was 50K–100K, at 3.75%. The 1K–5K band led 2025 at 4.40%, detailed further in nano-account engagement data.
Which Brand Industries Record the Highest TikTok Engagement?
Dash Social’s brand sample averaged 559.9K followers and eight posts per week over July to December 2025. Engagement came to 3.4% by followers and 4.4% by views.
The report says its headline rate dipped from 3.9% to 3.4%. Brands posting fewer than six times per week saw 93% higher engagement, per Dash Social.
| Industry | Engagement rate by views |
|---|---|
| Publishing | 5.3% |
| Media and Entertainment | 4.8% |
| Travel | 3.5% |
| Beauty | 2.8% |
| Wellness | 2.3% |
Source: Dash Social, 2026 TikTok Benchmark Report, Jul–Dec 2025
Media and Entertainment averaged 1.8M followers and 18 weekly posts, the largest audience and heaviest schedule of the five. Publishing reached 5.3% on 582.3K followers and 11 weekly posts.
Wellness ranks last by views but first by reach, at 8.1% on 133.7K average followers. The chart below plots engagement rate by reach, a separate Dash Social metric, and category gaps also show up in share rates by content category.
Views Down 31.30%: TikTok Reach Shifts Behind 2026 Engagement Rates
| Metric, average per post or total output | Change, Jan–Feb 2026 vs Jan–Feb 2025 |
|---|---|
| Video views | −31.30% |
| Reach | −28.73% |
| Interactions | −31.17% |
| Videos published | +72.10% |
Source: Metricool, 2026 TikTok Study, 2,314,756 posts from 92,000+ accounts, Jan–Feb 2025 vs Jan–Feb 2026
Views and interactions fell by near-identical margins. Metricool puts overall engagement across the sample at 3.67% and describes it as stable despite the view decline.
The For You Page supplied 72.70% of video views. Posts collected 96% of total reach within 10 days, which narrows the window covered by posting time and reach data.
Source: Metricool, 2026 TikTok Study, Jan–Feb 2026
Socialinsider’s platform rate by views held between 4.20% and 4.30% from Q1 2025 to Q1 2026, then fell to 3.85% in Q2 2026. Views and interactions both enter that ratio, a point also covered in save rate benchmarks.
In Socialinsider’s 100K–1M band, posting frequency rose from 15 to 23 between 2024 and 2025. Follower growth eased from 33% to 30%, while average views per post rose from 25,198 to 34,900.
Source: Socialinsider, 2026 TikTok Benchmarks, Jan 2024–Q2 2026
Paid amplification adds views outside these organic samples, tracked separately in sponsored versus organic TikTok engagement.
FAQs
What is a good engagement rate for a verified TikTok account?
It depends on the formula. Above 1.84% beats SociaVault’s 500K+ follower-based median (Feb–Mar 2026). Above 3.85% beats Socialinsider’s Q2 2026 rate by views. TokPortal’s 1M+ view-based median is 8.4%.
How many followers do you need to get verified on TikTok?
None. TikTok says follower and like counts are not a requirement. It checks whether an account is active, authentic, complete, featured in multiple news sources, and secured with multi-factor authentication.
Do verified TikTok accounts get more engagement, as Reddit threads often claim?
No TikTok dataset shows it. TikTok says the badge confirms authenticity and implies no endorsement. The only published verified split, HypeAuditor’s February 2020 study, covered Instagram and reported 30% higher engagement.
Do large TikTok accounts have lower engagement rates?
On follower-based math, yes: SociaVault’s median falls from 7.84% at 1K–10K to 1.84% at 500K+. View-based data differs, with TokPortal’s 1M+ tier averaging 9.15% against 7.83% at 100K–1M.
How is TikTok engagement rate calculated?
Two ways. Follower-based divides likes, comments, and shares by followers. View-based divides interactions by views; Socialinsider also counts saves. Compare benchmarks only when they share the same denominator.
Sources
https://www.socialinsider.io/social-media-benchmarks/tiktok
https://sociavault.com/blog/good-engagement-rate-tiktok
https://www.tokportal.com/data/tiktok-engagement-benchmarks
https://www.dashsocial.com/social-media-benchmarks/tiktok
https://insights.ttsvibes.com/tiktok-follower-to-engagement-decay-rate