TikTok Follower-to-Engagement Decay Rate Statistics 2026
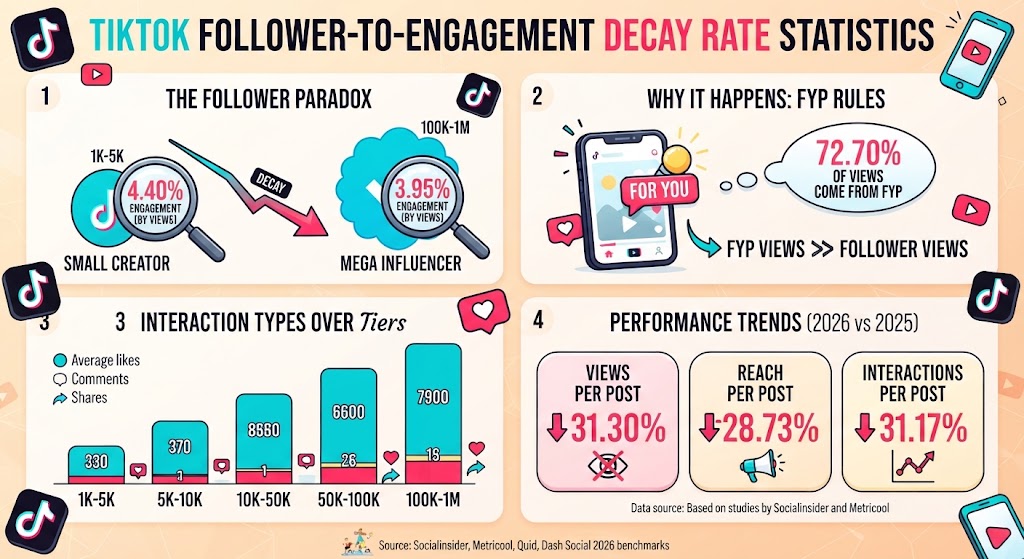
TikTok accounts with 100K–1M followers averaged 7,900 likes per post in 2025. Accounts with 1K–5K followers averaged 330. Measured against views instead of followers, those same two groups posted engagement rates of 3.95% and 4.40%. This page tracks what happens to TikTok interaction as follower counts climb, using Socialinsider’s 2-million-video dataset, Metricool’s 2.31-million-post study, and 2026 brand benchmarks from Quid and Dash Social.
TikTok Follower to Engagement Decay Rate
What the TikTok Follower to Engagement Decay Rate Measures
Raw interaction counts climb with audience size on TikTok. Rates measured against views do not.
Socialinsider tracked likes, comments and shares per post across five follower bands, drawing on 2 million videos from 214,507 profiles active between January 2024 and December 2025. Every metric rose from one tier to the next.
| Follower tier | Avg likes per post | Avg comments per post | Avg shares per post |
|---|---|---|---|
| 1K–5K | 330 | 8 | 40 |
| 5K–10K | 595 | 15 | 60 |
| 10K–50K | 1,325 | 25 | 120 |
| 50K–100K | 2,675 | 40 | 200 |
| 100K–1M | 7,900 | 100 | 477 |
Source: Socialinsider, 2026 TikTok Benchmarks, full-year 2025 averages
Comments scale least. The largest tier averaged 100 comments per post against 8 at the smallest, while likes moved from 330 to 7,900 across the same span.
Average likes per TikTok post by follower tier, 2024 vs 2025
Likes grew across every band year over year, averaging 9% growth. Shares grew fastest at the top, moving from 330 to 477 per post at the 100K–1M tier. Our breakdown of TikTok engagement rate across follower tiers covers the creator-side equivalent.
Does TikTok Engagement Rate Decay as Follower Counts Grow?
Not by much, once views replace followers as the denominator.
Socialinsider’s by-views rate spans 4.40% to 3.75% across the five tiers in 2025. The smallest accounts lead, mid-size accounts sit lowest, and the 100K–1M band ticks back up to 3.95%.
| Page size | Engagement rate by views, 2024 | Engagement rate by views, 2025 |
|---|---|---|
| 1K–5K | 4.20% | 4.40% |
| 5K–10K | 3.85% | 4.00% |
| 10K–50K | 3.80% | 3.90% |
| 50K–100K | 3.75% | 3.75% |
| 100K–1M | 3.95% | 3.95% |
Source: Socialinsider, 2026 TikTok Benchmarks, full-year 2024 and 2025
TikTok engagement rate by views across follower tiers, 2024 vs 2025
Socialinsider calculates this rate as likes, comments, shares and saves divided by views. Platform-wide, it moved from 3.85% in 2024 to 4.20% in 2025.
The same viewers convert at close to the same rate whoever published the video. What changes as an account scales is how many of its followers show up in the view count at all, a pattern that also shapes retention and completion behaviour.
TikTok Follower Growth Decay Rate by Account Size
Growth slowed in every band between 2024 and 2025, and the smallest accounts lost the most ground.
| Page size | Follower growth, 2024 | Follower growth, 2025 |
|---|---|---|
| 1K–5K | 269% | 150% |
| 5K–10K | 166% | 115% |
| 10K–50K | 86% | 60% |
| 50K–100K | 55% | 45% |
| 100K–1M | 33% | 30% |
Source: Socialinsider, 2026 TikTok Benchmarks, full-year 2024 and 2025
TikTok follower growth rate by page size, 2024 vs 2025
Socialinsider reports an average 33% decrease across the dataset. Metricool’s tier-movement figure points the other way on opportunity: 16.47% of TikTok accounts grew into a higher follower category over its study window, ahead of Instagram, LinkedIn, YouTube, Facebook, X and Pinterest.
Why Followers Stopped Predicting TikTok Reach
Metricool analysed 2,314,756 TikTok posts from more than 92,000 accounts, comparing January–February 2025 with January–February 2026. The For You Page delivered 72.70% of video views.
Followers are not the distribution channel. Most people who see a video do not follow the account that made it, which is why an account that triples its audience does not triple the reach of its next post.
Change in TikTok per-post performance, January–February 2026 vs 2025
Views fell 31.30% and interactions fell 31.17%. Reach fell 28.73%. Interaction dropped at almost exactly the rate distribution did.
Volume explains much of the squeeze. Metricool users published 72.10% more videos and nearly 140% more image and carousel posts year over year, while video still generated 5x more reach and 6x more interactions than images or carousels.
Hashtag traffic grew 114%, the largest gain Metricool recorded, and posts carrying at least one hashtag drew nearly 5% more views and more than 9% more interactions. Posts containing a question generated 26.19% more comments, and Metricool found that asking for comments lifted engagement 14% while asking for likes cut interactions 60%. That gap between prompt types shows up again in caption and copy testing.
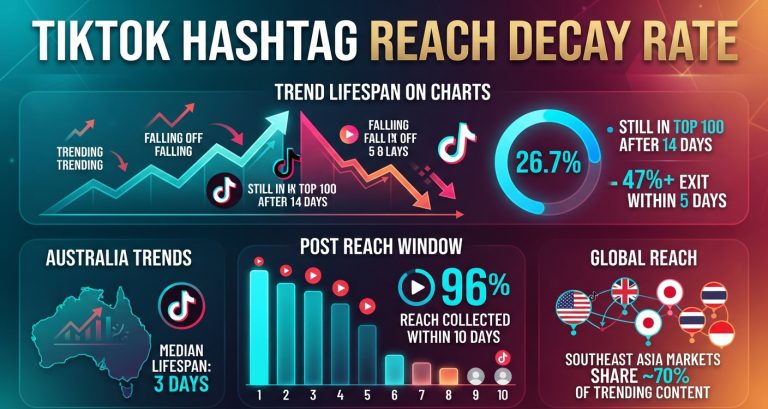
TikTok posts collect 96% of their total reach and nearly 98% of their interactions within the first 10 days, per the same study.
TikTok Engagement Decay Rate Across 2026 Benchmark Reports
Follower-based rates tell a harsher story than view-based ones, and they move on a different timeline.
| Period | TikTok engagement rate by followers |
|---|---|
| Full-year 2024 | 2.50% |
| Full-year 2025 | 3.70% |
| First half of 2026 | 2.70% |
Source: Socialinsider, 2026 Social Media Benchmarks, 70M posts, January 2024–December 2025 plus quarterly updates
TikTok engagement rate by followers, Socialinsider trendline
Socialinsider describes the 2.70% reading as its lowest in a year and a half, following a 20% drop through the first half of 2026. Its by-views rate held between 4.20% and 4.30% for five straight quarters from Q1 2025 before falling to 3.85% in Q2 2026.
Quid’s 2026 report puts the all-industry median at 2.01%, calculated as total interactions divided by follower count across 150 randomly selected companies in each of 18 industries, covering organic and paid posts. TikTok still topped every platform Quid measured, against 0.30% on Instagram and 0.03% on X.
Dash Social’s 2026 brand sample reports 3.4% by followers and 4.4% by views, on accounts averaging 559.9K followers. Its by-follower figure dipped from 3.9%.
The same platform reads between 2.01% and 4.40% in the same year depending on denominator, sample and whether the number is a mean or a median. Decay comparisons only hold inside one methodology, a caveat that also applies when weighing sponsored posts against organic ones.
Posting Frequency Rises as TikTok Engagement Decays
Brands answered thinner per-post returns with more posts. Socialinsider recorded a 40% average increase in posting frequency across every band.
| Page size | Monthly posts, 2024 | Monthly posts, 2025 |
|---|---|---|
| 1K–5K | 6 | 8 |
| 5K–10K | 7 | 12 |
| 10K–50K | 9 | 16 |
| 50K–100K | 11 | 18 |
| 100K–1M | 15 | 23 |
Source: Socialinsider, 2026 TikTok Benchmarks, full-year 2024 and 2025
Quid measured a different cadence in its brand sample, with a median of 1.98 videos per week on TikTok against 3.69 posts per week on Instagram. Dash Social put its brand average at eight posts per week and reported that brands posting fewer than six times per week saw 93% higher engagement.
Volume and returns are pulling apart. The relationship between cadence and audience gain is covered further in our analysis of TikTok posting frequency and growth, and category effects show up clearly in educational content benchmarks.
FAQs
What is the TikTok follower to engagement decay rate?
It describes interaction falling relative to audience size as an account scales. Socialinsider recorded 330 average likes per post at 1K–5K followers in 2025 against 7,900 at 100K–1M, while engagement by views moved only from 4.40% to 3.95%.
Why does my TikTok engagement drop after I gain followers, as Reddit creators often describe?
Followers barely function as distribution. Metricool found the For You Page delivers 72.70% of TikTok video views, so a bigger follower count raises the denominator without raising reach in step.
Which TikTok follower tier has the highest engagement rate?
The 1K–5K band, at 4.40% by views in 2025, per Socialinsider. The 50K–100K band sat lowest at 3.75%, and the 100K–1M band recorded 3.95%.
Is TikTok engagement falling platform-wide in 2026?
By some measures. Metricool recorded interactions per post down 31.17% and views down 31.30% year over year in January–February 2026, while Socialinsider’s by-follower rate fell to 2.70% in the first half of 2026.
Do Reddit posts about TikTok engagement benchmarks use the same numbers?
Rates vary by method, so figures shared online often conflict. TikTok reads 2.01% by followers in Quid’s 2026 median, 3.4% by followers and 4.4% by views in Dash Social’s brand sample, and 4.20% by views in Socialinsider’s 2025 data.
Sources
https://www.socialinsider.io/social-media-benchmarks/tiktok
https://metricool.com/press-release-tiktok-study-2026/
https://www.quid.com/knowledge-hub/resource-library/blog/2026-social-media-industry-benchmark-report
https://www.dashsocial.com/social-media-benchmarks/tiktok