TikTok Viral Video Follower Conversion Rate Statistics 2026
No benchmark publisher reports a TikTok viral video follower conversion rate. What they do publish is follower growth by account size, where a video’s views actually come from, and how far apart reach and views sit. This page pulls those figures from Metricool, Socialinsider, Dash Social and Pew Research Center, each one labelled with what it measures and when it was collected.
TikTok Viral Video Follower Conversion Rate
Is There a Published TikTok Viral Video Follower Conversion Rate?
None of the four largest 2026 TikTok studies reports follows divided by views. Socialinsider publishes a follower growth rate, Metricool publishes traffic sources and tier movement, Dash Social publishes engagement against reach and against views.
Follower growth rate is the closest published measure. Socialinsider defines it as followers gained divided by followers at the start of the period, multiplied by 100 — an account-level rate over a year, not a per-video one.
That distinction matters because a viral video and a year of posting sit on completely different denominators. Ratios built by dividing one publisher’s follower count by another’s view count are not measurements, a problem that also affects TikTok comment-to-view ratio benchmarks.
TikTok Viral Video Follower Conversion Rate By Account Size
Socialinsider analysed 2 million TikTok videos from 214,507 profiles active between January 2024 and December 2025. Growth slowed in all five follower bands, and the smallest accounts lost the most ground.
| Page size | Follower growth 2024 | Follower growth 2025 |
|---|---|---|
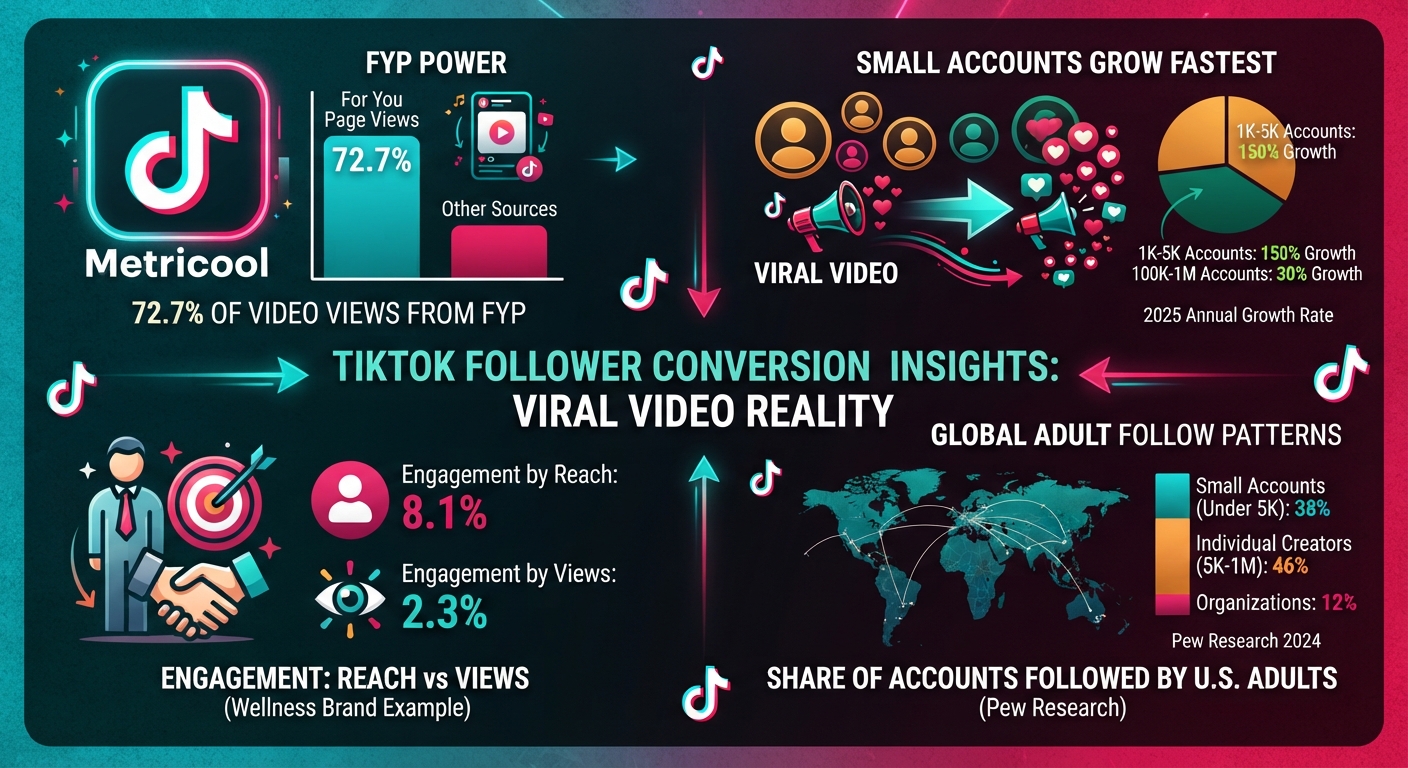
| 1K–5K | 269% | 150% |
| 5K–10K | 166% | 115% |
| 10K–50K | 86% | 60% |
| 50K–100K | 55% | 45% |
| 100K–1M | 33% | 30% |
Source: Socialinsider, 2026 TikTok Benchmarks, follower growth rate, full-year 2024 and full-year 2025
Socialinsider reports an average 33% decrease across the dataset and states the drop is not evenly distributed, with smaller accounts affected most. The 1K–5K band moved from 269% to 150%; the 100K–1M band moved from 33% to 30%.
Average views per post by follower tier
Views moved in opposite directions depending on tier over the same two years, which is why growth rates and view counts cannot be read as one story.
| Page size | Views 2024 | Views 2025 |
|---|---|---|
| 1K–5K | 860 | 350 |
| 5K–10K | 1,575 | 945 |
| 10K–50K | 3,655 | 3,240 |
| 50K–100K | 8,688 | 9,900 |
| 100K–1M | 25,198 | 34,900 |
Source: Socialinsider, 2026 TikTok Benchmarks, average views per post, full-year 2024 and full-year 2025
The 1K–5K tier averaged 350 views per post in 2025 and still grew 150%. The 100K–1M tier averaged 34,900 and grew 30%. Socialinsider records an average 23% decrease in views for smaller accounts, a pattern examined further in these TikTok nano-influencer engagement figures.
Engagement rate by views across the same five tiers
Reaction per view barely shifts as accounts scale, spanning 4.40% to 3.75% in 2025 and ticking back up in the top band.
| Page size | Engagement by views 2024 | Engagement by views 2025 |
|---|---|---|
| 1K–5K | 4.20% | 4.40% |
| 5K–10K | 3.85% | 4.00% |
| 10K–50K | 3.80% | 3.90% |
| 50K–100K | 3.75% | 3.75% |
| 100K–1M | 3.95% | 3.95% |
Source: Socialinsider, 2026 TikTok Benchmarks, engagement rate by views (likes, comments, shares and saves divided by views), full-year 2024 and full-year 2025
Platform-wide, Socialinsider’s engagement rate by views moved from 3.85% in 2024 to 4.20% in 2025, then held between 4.20% and 4.30% for five straight quarters before dropping to 3.85% in Q2 2026. Tier-level reaction rates are broken out further in these TikTok engagement rates by follower count.
Where Do Viral TikTok Views Come From?
Metricool analysed 2,314,756 TikTok posts from more than 92,000 accounts, comparing January–February 2026 against January–February 2025. The For You page delivered 72.70% of video views.
Posts also reach 96% of their total reach and nearly 98% of their total interactions within the first 10 days. A video that has delivered 96% of its reach has delivered nearly all the follow decisions it will ever prompt.
| Metricool measure | Value |
|---|---|
| Share of video views from the For You page | 72.70% |
| Share of total reach captured in 10 days | 96% |
| Share of total interactions captured in 10 days | Nearly 98% |
| Accounts moving into a higher follower category | 16.47% |
| Accounts under 100K followers that grew | 44% |
Source: Metricool, 2026 TikTok Study, 2,314,756 posts from more than 92,000 accounts, January–February 2026 against January–February 2025, published May 2026
What Happened to TikTok Views and Interactions in 2026?
Views and interactions per post fell almost in step. Metricool users published 72.10% more videos and nearly 140% more image and carousel posts over the same window.
| Per-post average | Year-over-year change |
|---|---|
| Video views | Down 31.30% |
| Reach | Down 28.73% |
| Interactions | Down 31.17% |
Source: Metricool, 2026 TikTok Study, per-post averages, January–February 2026 against January–February 2025
Interactions fell 31.17% against 31.30% for views, close to in step. Metricool attributes the decline to saturation rather than audience behaviour, with CEO Juan Pablo Tejela stating the platform is more crowded than a year ago. Posting cadence and its effect on distribution is covered in these TikTok posting frequency benchmarks.
TikTok Viral Video Follower Conversion Rate Against Repeat Views
Dash Social publishes engagement against reach and against views separately for five brand industries. Reach counts people; views count plays, and one person can supply several.
| Industry | Engagement by reach | Engagement by views | Weekly posts |
|---|---|---|---|
| Wellness | 8.1% | 2.3% | 6 |
| Publishing | 6.1% | 5.3% | 11 |
| Media and Entertainment | 5.1% | 4.8% | 18 |
| Travel | 4.2% | 3.5% | 4 |
| Beauty | 4.1% | 2.8% | 8 |
Source: Dash Social, 2026 TikTok Benchmark Report, brand accounts, first half of 2026
Wellness shows the widest gap in the sample, 8.1% by reach against 2.3% by views, on the smallest follower base at 133.7K. Media and Entertainment shows the narrowest, 5.1% against 4.8%, on the largest at 1.8M.
Any conversion figure calculated on views rather than reach describes a different denominator in every category. How far content travels beyond the first viewer is tracked in these TikTok share rate figures by content category.
TikTok Viral Video Follower Conversion Rate And What U.S. Adults Follow
Pew Research Center collected every account followed by 664 U.S. adult TikTok users from the American Trends Panel, producing 227,946 unique accounts. Collection ran April 8–16, 2024.
| Pew Research measure | Value |
|---|---|
| Median accounts followed per user | 144 |
| Accounts followed by a single user in the sample | Roughly 150,000 |
| Accounts followed by more than five users | Around 10,600, or 5% |
| Followed accounts with fewer than 5,000 followers | 38% |
| Followed accounts with 1 million followers or more | 6% |
| Mega-influencer share of the typical user’s list | 22% |
Source: Pew Research Center, “Who U.S. Adults Follow on TikTok,” 664 U.S. adult TikTok users, followed-account data collected April 8–16, 2024
Roughly 150,000 of the accounts were followed by exactly one person in the sample. Pew reports that two randomly selected users would share fewer than two followed accounts on average.
Accounts over a million followers are 6% of all follow relationships but 22% of the typical list. A small set of very large accounts appears on almost every list while the long tail holds most of the distinct relationships, which is part of why engagement decays as follower counts climb.
FAQs
What is a good TikTok viral video follower conversion rate?
No benchmark publisher reports follows per view. Socialinsider publishes annual follower growth instead: 150% for accounts at 1K–5K followers and 30% at 100K–1M across full-year 2025.
How many followers does a viral TikTok video bring?
Metricool and Socialinsider do not publish follows per video. Metricool found 16.47% of accounts moved into a higher follower category year over year, and 44% of accounts under 100K followers grew.
Do small TikTok accounts grow faster than large ones?
Yes. Socialinsider recorded 150% follower growth for 1K–5K accounts in 2025 against 30% for 100K–1M accounts, on 350 and 34,900 average views per post respectively.
What does Reddit say about TikTok follower conversion rates?
Reddit creator threads circulate follows-per-view figures, but none trace to a published dataset. Metricool, Socialinsider, Dash Social and Pew Research Center are the four 2026 studies that publish measured TikTok audience data.
Does the For You page bring in more followers than the Following feed?
Metricool found the For You page delivered 72.70% of TikTok video views in early 2026. Metricool does not split follower gains by traffic source, so the view share is what is measured.
Sources
- https://metricool.com/press-release-tiktok-study-2026/
- https://www.socialinsider.io/social-media-benchmarks/tiktok
- https://www.pewresearch.org/data-labs/2024/10/08/who-u-s-adults-follow-on-tiktok/
- https://www.dashsocial.com/social-media-benchmarks/tiktok
- https://www.quantumrun.com/consulting/most-popular-social-media/