TikTok Scroll-Past Rate Statistics 2026 [Data]
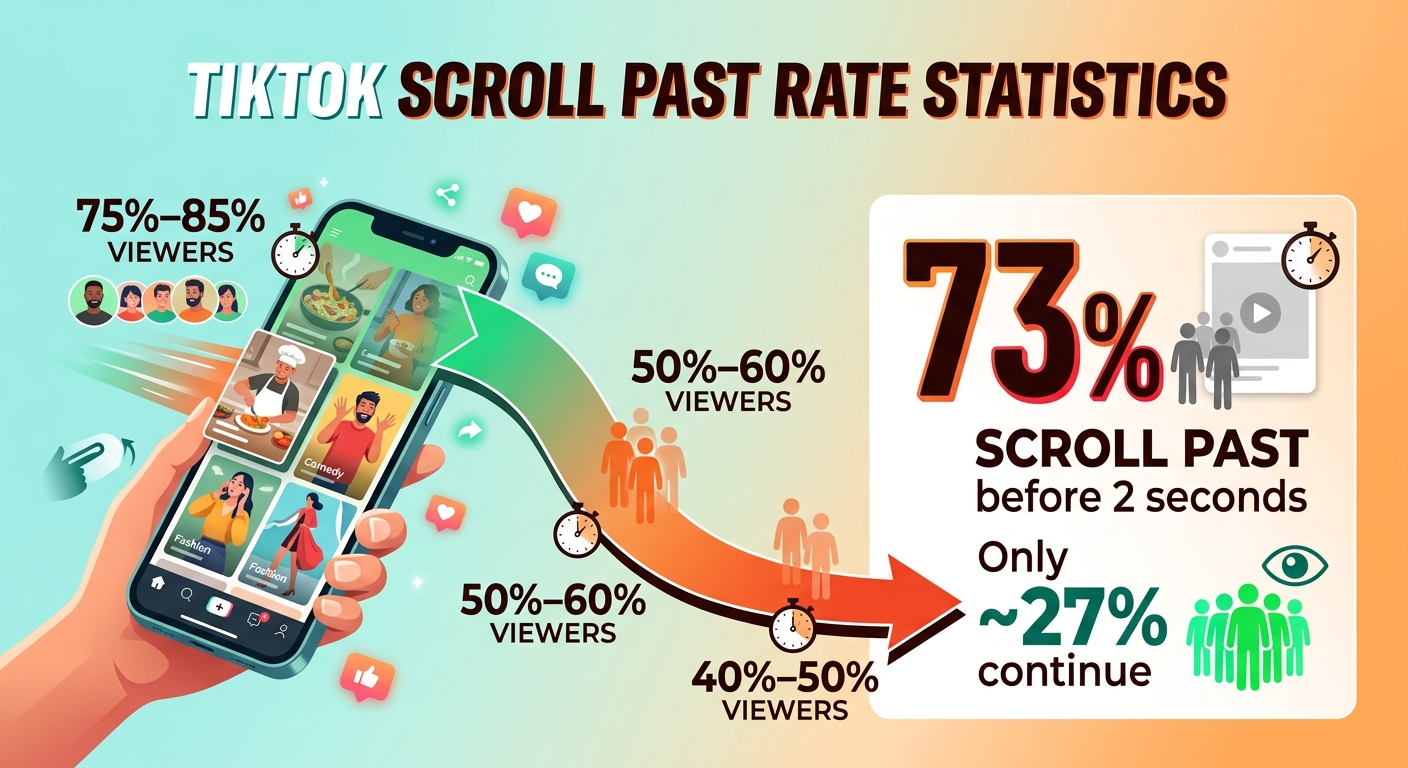
TikTok’s 2-second view rate carries a median of about 27%, according to AdSights benchmark ranges updated 11 July 2026. Read the other way, roughly 73% of TikTok ad impressions are scrolled past before they ever count as a view. This post collects the published figures on TikTok scroll past rate: the benchmark bands, the cross-platform thresholds, the second-by-second drop-off curve, and the feed conditions behind it.
TikTok Scroll Past Rate: Key Numbers
What Does TikTok Scroll Past Rate Measure?
Scroll past rate is not a metric TikTok reports. It is the complement of the 2-second view rate, which AdSights defines as qualified views divided by video impressions.
The threshold matters more than the percentage. TikTok counts a view at 2 seconds; Meta uses 3; YouTube TrueView counts at 30 seconds or completion. Identical percentages on two platforms describe different amounts of watched video.
TikTok also sells attention further down the curve. Its video views objective runs on focused view optimization, available in 6-second, 15-second, and 15-second-with-completion options, and TikTok excludes interactions occurring within the first second from both the focused view count and billing.
Source: TikTok Ads Manager Help Center, “About the video views objective and focused view optimization”, accessed September 2026; AdSights, View Rate glossary entry, updated 11 July 2026
TikTok Scroll Past Rate Benchmarks in 2026
AdSights publishes typical ranges and medians for both TikTok view thresholds. Subtracting each median from 100% gives the share of impressions that never reached it.
| TikTok view threshold | Typical view rate | Median | Impressions below threshold |
|---|---|---|---|
| 2-second view rate | 20% – 35% | ~27% | ~73% |
| 6-second view rate | 12% – 22% | ~17% | ~83% |
Source: AdSights, View Rate glossary entry, updated 11 July 2026. Measurement: qualified views divided by video impressions. The fourth column is the arithmetic complement of the published median.
The 6-second rate runs roughly 40% to 60% lower than the 2-second rate, per the same AdSights notes. Four seconds of extra runtime costs a further ten points of impressions at the median.
Billo sets tiers on the same 2-second formula: 40% and above is elite, 30% to 39% is competitive, and below 25% is what it calls the fix-it zone. Billo states those ranges draw on multi-account studies published between 2022 and 2025, so they describe accumulated practice rather than a single current sample. The most-cited of those studies is Tuff Growth’s, which recorded a 30.66% average hook rate across 11 TikTok accounts it managed between 1 January and 30 June 2022, with several accounts in the 40% to 45% range. That average sits inside Billo’s competitive band, one point above its 30% floor. How the loss distributes across the opening three seconds of playback is a separate question from the impression-level rate.
How TikTok Scroll Past Rate Compares With Meta and YouTube
AdSights publishes view-rate medians for five platform-placement combinations. Each row uses the same formula but a different duration threshold, so the medians rank thresholds as much as creative.
| Platform and placement | View threshold | Typical range | Median |
|---|---|---|---|
| YouTube TrueView, skippable in-stream | 30s or completion | 25% – 45% | ~35% |
| Meta Reels | 3 seconds | 24% – 36% | ~30% |
| TikTok in-feed | 2 seconds | 20% – 35% | ~27% |
| Meta in-feed, DTC prospecting | 3 seconds | 15% – 28% | ~23% |
| TikTok in-feed | 6 seconds | 12% – 22% | ~17% |
Source: AdSights, View Rate glossary entry, updated 11 July 2026. Measurement: qualified views divided by video impressions, threshold as stated per row.
TikTok’s 2-second median of 27% sits below Meta Reels at 30%, despite clearing a bar one second shorter. AdSights states plainly that view rates are only comparable within the same platform and placement. Placement moves the number more than platform does: Meta Reels runs seven points above Meta in-feed on the identical 3-second threshold. Whether an ad is bought or earned shifts the picture again, which is visible in how sponsored and organic TikTok posts perform against each other.
Where TikTok Viewers Scroll Off in the First 15 Seconds
SociaVault pulled second-by-second retention curves for hundreds of top-performing TikTok ads, drawing on TikTok Creative Center rankings across all 21 industry categories over a 180-day window in the United States, United Kingdom, Germany, Japan and Brazil.
| Elapsed time | Viewers still watching |
|---|---|
| Start of playback | 100% |
| 1 second | 75% – 85% |
| 3 seconds | 50% – 60% |
| 6 seconds | 40% – 50% |
| 15 seconds | 25% – 35% |
Source: SociaVault, “TikTok Ad Creative Trends in 2026”, published 12 June 2026, based on top-performing ads in TikTok Creative Center over a 180-day window
SociaVault calls the first second an irreducible scroll-through loss and attributes the drop between seconds one and three to hook quality. Its pass mark: 55% or higher still watching at second three is a strong hook by top-performer standards, and below 40% at second three needs a rebuild rather than an iteration.
This curve describes ads TikTok already ranks as high performers, so it is a ceiling rather than an average. Even at that ceiling, half the audience is gone by second three.
TikTok Retention Targets by Video Length
Organic creator analytics measure something different. Retensis publishes average watch time as a share of total video length, read from the TikTok Studio retention graph. A 45% figure is a problem on a 15-second clip and a good result on a three-minute one.
| Video length | Aim for | Strong |
|---|---|---|
| Under 15 seconds | Above 60% | Above 75% |
| 15 to 30 seconds | Above 50% | Above 65% |
| 30 to 60 seconds | Above 40% | Above 55% |
| 60 seconds to 3 minutes | Above 30% | Above 45% |
| Over 3 minutes | Above 20% | Above 35% |
Source: Retensis, “TikTok Retention Rate Benchmarks 2026”, published 26 April 2026, updated 25 August 2026. Measurement: average watch time as a percentage of video length, not a share of viewers.
The gap between the target and the strong level holds at exactly 15 points across every length band. The target itself falls 10 points per step. Retensis also treats a drop above 30% inside the first three seconds as evidence the opening frame is failing, a threshold that connects the watch-time view back to the hook. Length choices feed straight into this, and average clip length on TikTok has been climbing.
TikTok Retention Benchmarks by Content Niche
Retensis sets separate targets by category. The spread runs 35 points between the highest and lowest.
| Niche and format | Target average watch time |
|---|---|
| Entertainment and comedy, under 20 seconds | Above 70% |
| Food and recipe tutorials, under 30 seconds | Above 60% |
| Fitness, workout follow-along | Above 55% |
| Educational and explainer, under 30 seconds | Above 50% |
| Gaming, highlight clips | Above 45% |
| Finance, informational | Above 40% |
| Gaming, extended play | Above 35% |
Source: Retensis, “TikTok Retention Rate Benchmarks 2026”, published 26 April 2026, updated 25 August 2026
Retensis attributes the low educational figure to viewers leaving once they have what they came for, and recommends save rate above 3% and share rate above 1% as better signals in that niche. Comedy under 20 seconds carries the highest bar on the list. These targets sit alongside completion rates across video lengths and save-rate benchmarks, which measure different points on the same curve.
Why TikTok Scroll Past Rate Faces More Pressure
Metricool analysed 2,314,756 TikTok posts from more than 92,000 accounts, comparing January and February 2026 against the same two months in 2025. Publishing volume rose while per-post performance fell across every headline metric.
| Metric, per post | Year-over-year change |
|---|---|
| Video views | −31.30% |
| Reach | −28.73% |
| Interactions | −31.17% |
| Videos published | +72.10% |
Source: Metricool, 2026 TikTok Study press release, 12 May 2026. Sample: 2,314,756 posts from more than 92,000 accounts, January–February 2025 compared with January–February 2026.
Metricool also recorded image and carousel posts up nearly 140%, the For You Page delivering 72.70% of video views, and posts collecting 96% of their total reach within the first 10 days. Metricool describes the platform as entering a phase of saturation. It does not claim the volume increase caused the per-post declines, and neither does this post; the two moved together across the same window. Views and interactions fell within 0.13 percentage points of each other, so the interaction-to-view relationship held steadier than either count alone, a pattern that also shows up in how engagement decays as accounts grow.
One counterweight sits in the same study. Metricool found 16.47% of TikTok accounts moved into a higher follower category over the year, ahead of Instagram, LinkedIn, YouTube, Facebook, X and Pinterest. Time spent in the app remains the backdrop to all of it, tracked in daily watch time per user.
FAQs
What is a good TikTok scroll past rate?
Below 60% is elite, since Billo puts the elite hook rate at 40% and above. Below 70% is competitive. Above 75% falls into Billo’s fix-it zone, which corresponds to a hook rate under 25%.
How is TikTok scroll past rate calculated?
Subtract the 2-second view rate from 100%. AdSights defines the 2-second view rate as qualified views divided by video impressions, with a typical range of 20% to 35% and a median near 27%.
Do TikTok and Meta measure scroll past the same way?
No. TikTok counts a view at 2 seconds, Meta at 3. AdSights states view rates are only comparable within one platform and placement. TikTok’s median sits at 27% against 30% for Meta Reels.
Why do Reddit threads quote such different TikTok hook rate numbers?
The published bands come from different vendors, periods and samples. Billo’s tiers rest on studies published between 2022 and 2025, including Tuff Growth’s 30.66% average from 11 accounts in 2022. AdSights medians were updated July 2026.
Does Reddit advice about fixing the first three seconds match the data?
It aligns with both published curves. Retensis flags any drop above 30% inside the first three seconds as a failing opening. SociaVault records 50% to 60% still watching at second three on top-performing ads.
Sources
https://sociavault.com/blog/tiktok-ad-creative-trends-2026https://retensis.com/blog/tiktok-retention-rate-benchmarks-2026
https://metricool.com/press-release-tiktok-study-2026/