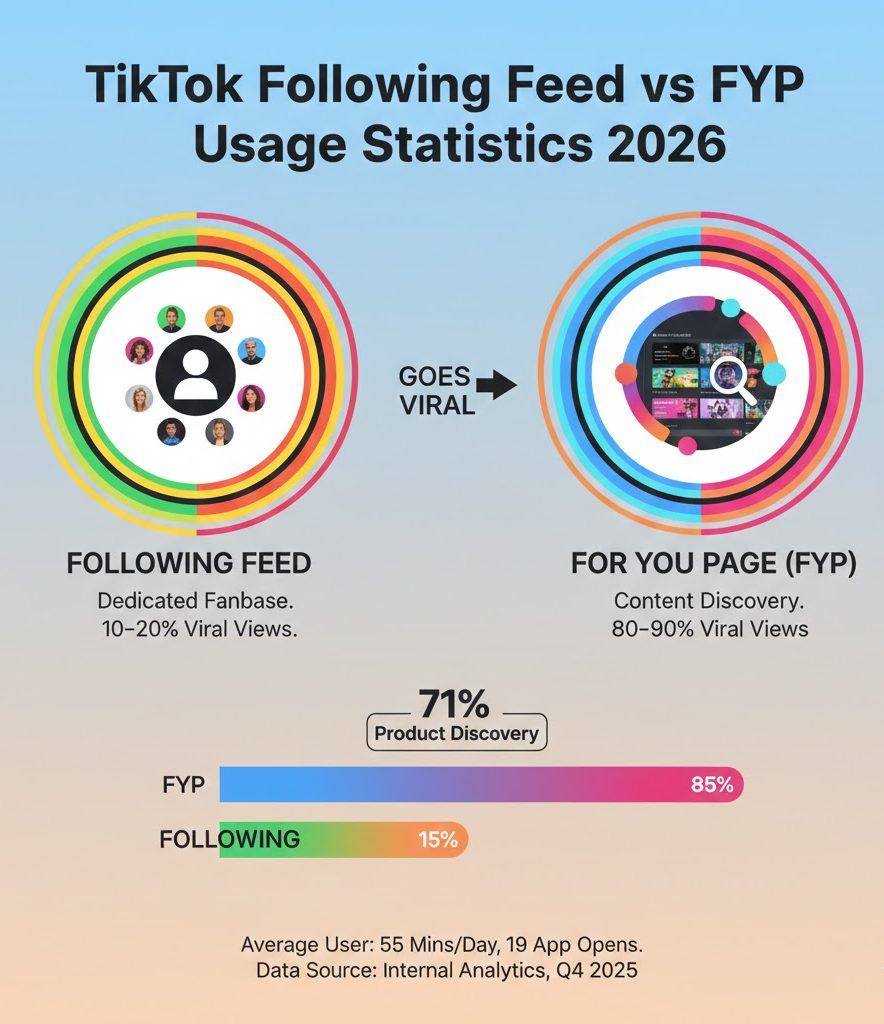
TikTok Following Feed vs FYP Usage Statistics 2026
TikTok’s For You Page accounts for 80-90% of viral video views, with the #fyp hashtag accumulating 100 trillion lifetime views as of October 2025. The algorithmic feed dominates content discovery while the Following Feed serves a secondary role for maintaining creator relationships. TikTok users spend an average of 34 hours and 56 minutes monthly on the platform, with 71% discovering products they had not seen elsewhere through FYP recommendations.
TikTok FYP vs Following Feed Key Statistics
- TikTok’s #fyp hashtag reached 100 trillion lifetime views as of October 2025, making it the platform’s most-used hashtag
- Viral videos on TikTok receive 80-90% of their views from the For You Page, with only 10-20% coming from the Following Feed
- 71% of TikTok users discover products they had not seen elsewhere through the platform’s algorithmic feed
- TikTok users open the app an average of 19 times daily, spending 55 minutes and 48 seconds on the platform each day
- The average brand earns 12.8 views per 100 followers on TikTok, demonstrating how FYP distribution extends reach beyond follower bases
TikTok FYP Hashtag Performance and Creator Strategy
The #fyp hashtag accumulated 100 trillion lifetime views by October 2025, representing creators’ primary strategy for algorithmic distribution. This figure dwarfs the #foryou hashtag’s 50.9 trillion views and demonstrates the overwhelming focus on FYP placement over follower-based content delivery.
Creators tag content with #fyp to signal their intent for For You Page distribution. The hashtag’s dominance reflects TikTok’s fundamental departure from traditional social media’s follower-centric model toward an interest graph that prioritizes predicted user preferences.
| Hashtag | Lifetime Views | Primary Purpose |
|---|---|---|
| #fyp | 100 trillion | For You Page targeting |
| #foryou | 50.9 trillion | Alternative FYP targeting |
| #entertainment | 535 billion | Content category tagging |
TikTok FYP View Distribution Across Content Performance Tiers
Video performance on TikTok directly correlates with FYP penetration. Viral content receives 80-90% of views from the For You Page, while the Following Feed contributes just 10-20% of total views for high-performing videos.
Average performing videos show a more balanced split, with 50-70% of views originating from FYP and 30-50% from the Following Feed. Underperforming content sees the Following Feed contribute a higher proportion of views, indicating weak algorithm penetration.
When creators notice their FYP traffic percentage dropping below 50%, it signals the algorithm is not distributing their content to non-followers. Accounts where most views come from existing followers struggle to scale reach beyond their established audience.
Content Discovery Patterns by Account Size
Accounts under 5,000 followers average 43 views per 100 followers, representing a 43% reach rate driven primarily by FYP testing. TikTok aggressively tests content from small creators, giving them comparable distribution opportunities to established accounts when engagement signals are strong.
Mid-tier accounts with 5,000 to 100,000 followers see this percentage drop to 15-25%, indicating proportionally less FYP distribution per follower as accounts grow. The top 25% of brands achieve over 35 views per 100 followers through consistent FYP success.
TikTok User Engagement Rates by Feed Type
TikTok’s platform-wide engagement rate stood at 4.64% in 2024, down from 5.77% in 2023. This metric encompasses interactions from both FYP and Following Feed viewers, though engagement patterns differ significantly between the two discovery methods.
Smaller accounts under 5,000 followers maintain a 4.20% engagement rate as the algorithm tests their content in the FYP. Mid-sized accounts with 5,000 to 100,000 followers see rates between 3.5-4.0%, while accounts over 100,000 followers typically achieve 3.0-3.5% engagement.
| Account Size | Average Engagement Rate | Primary Discovery Source |
|---|---|---|
| Under 5K followers | 4.20% | FYP algorithm testing |
| 5K-100K followers | 3.5-4.0% | Mixed FYP and Following |
| Over 100K followers | 3.0-3.5% | Higher Following proportion |
| Over 10M followers | 10.5% | Dedicated fanbase loyalty |
Large accounts over 10 million followers show significantly higher engagement rates at 10.5%, driven by dedicated fanbases. However, their views-per-follower ratio tends to be lower than smaller accounts, as the Following Feed plays a more prominent role in their content distribution.
TikTok Daily Usage and Time Spent Statistics
Global TikTok users spent 34 hours and 56 minutes on the platform monthly as of November 2024, translating to approximately 55 minutes and 48 seconds daily. Users in the United States recorded slightly higher usage at 58 minutes per day.
The platform sees an average of 19 app opens daily per user, with a 64.4% daily open rate. This pattern indicates users engage with TikTok in short, frequent bursts throughout the day rather than extended single sessions.
Each session typically begins on the For You Page, with users switching to the Following Feed only when seeking content from specific creators they follow. The FYP’s dominance in session initiation demonstrates its role as TikTok’s primary content gateway.
TikTok Algorithm Ranking Signals for FYP Distribution
TikTok’s algorithm explicitly excludes follower count when determining For You Page placement. Instead, engagement signals from initial test audiences determine whether content receives broader distribution to non-followers.
Watch time and completion rate serve as the primary ranking factors, with rewatches and replays indicating strong viewer interest. Shares represent the strongest viral signal, as they demonstrate users found content valuable enough to distribute beyond the platform.
| Ranking Signal | Weight | Impact on Distribution |
|---|---|---|
| Watch time / completion rate | High | Primary ranking factor |
| Rewatches and replays | High | Strong interest indicator |
| Shares | High | Strongest viral signal |
| Comments | Medium-High | Community engagement |
| Likes | Medium | Basic approval signal |
| Follower count | Not considered | No direct impact |
This ranking structure explains how new creators achieve viral reach while established accounts may see limited distribution on underperforming content. High-quality creators receive 72% more watch time per view and achieve follower growth rates over 40 times higher than average creators.
TikTok Content Discovery Through Algorithmic Feeds
TikTok’s algorithm-driven model results in 71% of users discovering products they had not seen elsewhere on the platform. This discovery rate far exceeds follower-based social platforms where users primarily see content from accounts they already follow.
92% of users take action after viewing content through the For You Page, including likes, shares, follows, or searches. This high action rate demonstrates that FYP content drives meaningful engagement rather than passive scrolling.
64% of Gen Z users employ TikTok as a search engine for product and information searches, while 81% of all users discovered something new through the platform. These statistics highlight the FYP’s effectiveness at matching content to interested viewers regardless of prior connections.
Following Feed Role in Creator Relationships
The Following Feed strengthens creator-audience relationships established through FYP discovery. 76% of users prefer brand participation in interest groups over mass reach, indicating community connection matters alongside algorithmic exposure.
72% of women find community connection easy on TikTok, with users being four times more likely to call TikTok the best platform for community compared to competitors. The Following Feed enables users to maintain these connections with creators they discovered through algorithmic means.
FAQs
What percentage of TikTok views come from the For You Page?
Viral videos receive 80-90% of their views from the For You Page, with only 10-20% coming from the Following Feed. Average performing videos show a more balanced split at 50-70% FYP and 30-50% Following Feed.
How much time do users spend on TikTok daily?
Global users spend an average of 55 minutes and 48 seconds on TikTok daily, opening the app approximately 19 times per day. U.S. users record slightly higher usage at 58 minutes daily as of November 2024.
Does follower count affect TikTok FYP distribution?
No, TikTok’s algorithm does not consider follower count when determining For You Page placement. Distribution depends on engagement signals like watch time, completion rate, shares, and comments from initial test audiences.
What is TikTok’s average engagement rate in 2024?
TikTok’s platform-wide engagement rate stood at 4.64% in 2024, down from 5.77% in 2023. Small accounts under 5,000 followers maintain 4.20% engagement, while accounts over 100,000 followers average 3.0-3.5%.
How many views does the average TikTok video get per follower?
The average brand earns 12.8 views per 100 followers on each video. Accounts under 5,000 followers average 43 views per 100 followers, while top-performing brands achieve over 35 views per 100 followers.