TikTok Share Rate By Content Category Statistics 2026
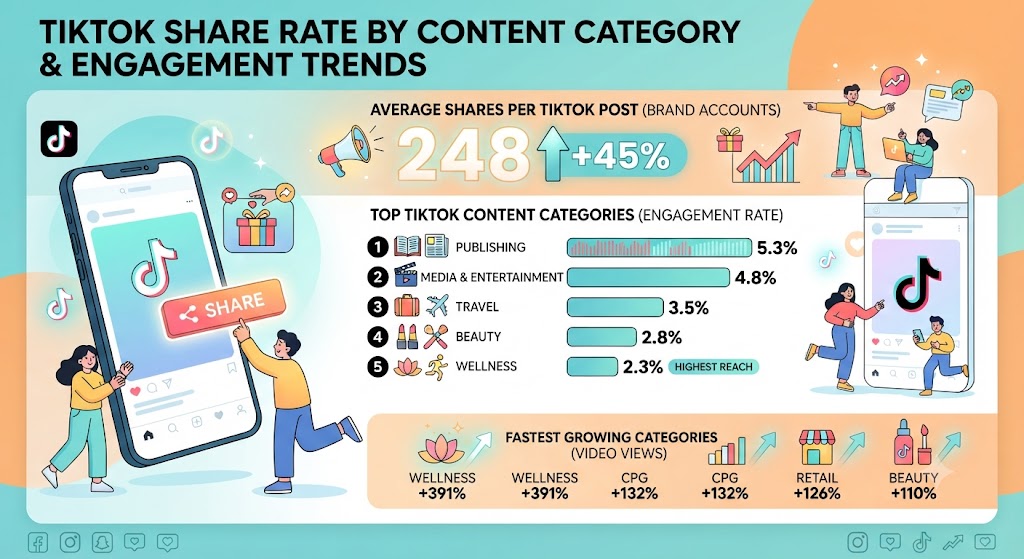
Brand accounts on TikTok averaged 248 shares per post in 2025, up 45% from 170 in 2024, based on Socialinsider’s analysis of 70 million posts from international brand pages. Comments fell 24% over the same window. This report covers verified TikTok share and engagement benchmarks by content category, using primary data from Socialinsider, Dash Social, and eMarketer published between January and June 2026.
TikTok Share Rate By Content Category
How Many Shares Does A TikTok Post Get In 2026?
Socialinsider tracked 70 million posts from international brand accounts between January 2024 and December 2025. TikTok brand posts moved from 170 average shares in 2024 to 248 in 2025.
The direction of engagement changed more than its volume. Shares rose 45% while comments dropped from 66 to 50 per post, a 24% decline.
| Metric (brand accounts) | 2024 | 2025 | Change |
|---|---|---|---|
| Shares per post | 170 | 248 | +45% |
| Comments per post | 66 | 50 | −24% |
| Likes per post | 3,092 | 3,492 | +12% |
| Views per post | 6,268 | 6,496 | +3% |
| Engagement rate by followers | 2.50% | 3.70% | +49% |
Source: Socialinsider 2026 Social Media Benchmarks, 70M posts, January 2024 to December 2025
Socialinsider calculates TikTok engagement rate as likes, comments, shares, and saves divided by followers. Shares carry a growing portion of that total, which matters for creators who monetize distribution through tools like a TikTok earnings calculator.
TikTok Shares Vs Instagram, Facebook, And X
TikTok’s 248 average shares per brand post in 2025 compares with 45 on Instagram, 17 on Facebook, and 1 on X, all from the same Socialinsider dataset. Instagram shares grew 12% and Facebook shares grew 30% year over year, both from far smaller bases.
Voiceover-led formats travel across all four platforms, and many creators now produce narration with AI voice generators built for short-form video before repurposing clips.
TikTok Engagement By Content Category In 2026
Dash Social’s 2026 TikTok Benchmark Report publishes engagement rates for five brand industries: Beauty, Media and Entertainment, Publishing, Travel, and Wellness. Publishing leads at 5.3% engagement by views and 6.1% by reach, with a 4.5 Entertainment Score, the highest in the sample.
Wellness records the lowest view-based engagement at 2.3% but the highest reach-based engagement at 8.1%, on the smallest average audience of 133.7K followers.
| Industry | Engagement Rate / Views | Engagement Rate / Reach | Entertainment Score | Weekly Posts |
|---|---|---|---|---|
| Publishing | 5.3% | 6.1% | 4.5 | 11 |
| Media and Entertainment | 4.8% | 5.1% | 4.0 | 18 |
| Travel | 3.5% | 4.2% | 3.5 | 4 |
| Beauty | 2.8% | 4.1% | 2.9 | 8 |
| Wellness | 2.3% | 8.1% | 2.7 | 6 |
Source: Dash Social 2026 TikTok Benchmark Report, brand accounts, published 2026
Across all industries in the Dash Social sample, brands average 559.9K followers, eight posts per week, 3.4% engagement by followers, and 4.4% engagement by views. Brands posting fewer than six times per week see 93% higher engagement than the sample overall.
Category-level engagement only tells half the commerce story. Our breakdown of TikTok Shop conversion rates by category shows where that interaction turns into purchases.
Which TikTok Content Categories Are Growing Fastest?
Attention moved toward commerce-adjacent categories in late 2025. TikTok average monthly video views grew 68% year over year in Q4 2025, according to eMarketer’s Industry KPIs data provided by Dash Social.
Wellness led with 391% growth, followed by CPG at 132% and retail at 126%. Food and beverage was the only category to decline, down 15%.
| Content Category | YoY Video View Growth, Q4 2025 |
|---|---|
| Wellness | +391% |
| CPG | +132% |
| Retail | +126% |
| Beauty | +110% |
| Home | +91% |
| Fashion | +83% |
| Food and Beverage | −15% |
Source: eMarketer Industry KPIs, data provided by Dash Social, Q4 2025
The wellness surge continued into 2026. TikTok video views for wellness brands grew 646.9% year over year in Q1 2026, even as views across all industries fell 6%, per eMarketer’s report on Dash Social’s Q1 2026 data.
Shared clips also feed live discovery, a dynamic covered in our TikTok Live viewer retention benchmarks and the related data on Live follower conversion rates.
TikTok Share Rate And Engagement Trend Through 2026
The 2025 gains have cooled in 2026. Socialinsider’s mid-year update puts TikTok’s engagement rate by followers at 2.70% for the first half of 2026, a 20% drop and the platform’s lowest reading in a year and a half.
Measured by views, Socialinsider’s analysis of more than 2 million TikTok posts shows engagement held between 4.20% and 4.30% for five straight quarters from Q1 2025 through Q1 2026, then fell to 3.85% in Q2 2026, an 8% quarterly decrease.
Source: Socialinsider TikTok Benchmarks and quarterly update, H1 2026
Dash Social’s 2026 report shows the same cooling on the brand side, with engagement by followers dipping from 3.9% to 3.4%. Brands amplifying their most-shared organic posts can compare paid options in our analysis of Spark Ads vs In-Feed Ads performance.
FAQs
What is the average TikTok share rate in 2026?
Brand accounts averaged 248 shares per TikTok post in 2025, up 45% from 170 in 2024, based on Socialinsider’s study of 70 million posts from January 2024 to December 2025.
Which content category has the highest TikTok engagement rate?
Publishing leads at 5.3% engagement by views and 6.1% by reach in Dash Social’s 2026 TikTok Benchmark Report. Wellness posts the highest reach-based engagement at 8.1%.
Are the TikTok share numbers quoted on Reddit accurate?
Reddit threads often mix follower-based and view-based rates, which are different metrics. The verified brand benchmarks are 248 shares per post and a 3.70% engagement rate by followers for 2025, per Socialinsider.
Why do creators on Reddit report far fewer shares than 248 per post?
The 248 figure covers brand accounts, which average 559.9K followers in Dash Social’s sample. Reddit posters running small accounts sit outside that population, so their share counts land well below the brand benchmark.
Is TikTok engagement rising or falling in 2026?
Falling. Socialinsider measured 2.70% engagement by followers in H1 2026, down 20%, and engagement by views fell from the 4.20% to 4.30% range to 3.85% in Q2 2026.
Sources
https://www.socialinsider.io/social-media-benchmarks
https://www.socialinsider.io/social-media-benchmarks/tiktok
https://www.dashsocial.com/social-media-benchmarks/tiktok
https://www.emarketer.com/content/industry-kpis–commerce-categories-driving-tiktok-view-growth