TikTok Product Tag Click-Through Rate Statistics 2026
A strong TikTok product tag click-through rate sits at 2.0–3.5% for organic Shop content, the number MomentIQ ties most closely to Shop revenue in its 2025 benchmarks. Elite nano creators clear 4.0%. This post covers verified 2025 product tag CTR by creator size, category, and content format, and how paid TikTok ad CTR compares across ecommerce verticals.
TikTok Product Tag Click-Through Rate: Key Facts
The tap on a product tag is where a view turns into product-page traffic. Here is what the verified 2025 data shows.
- Organic product tag CTR of 2.0–3.5% marks the “Great” tier and the metric most tied to Shop revenue (MomentIQ, 2025).
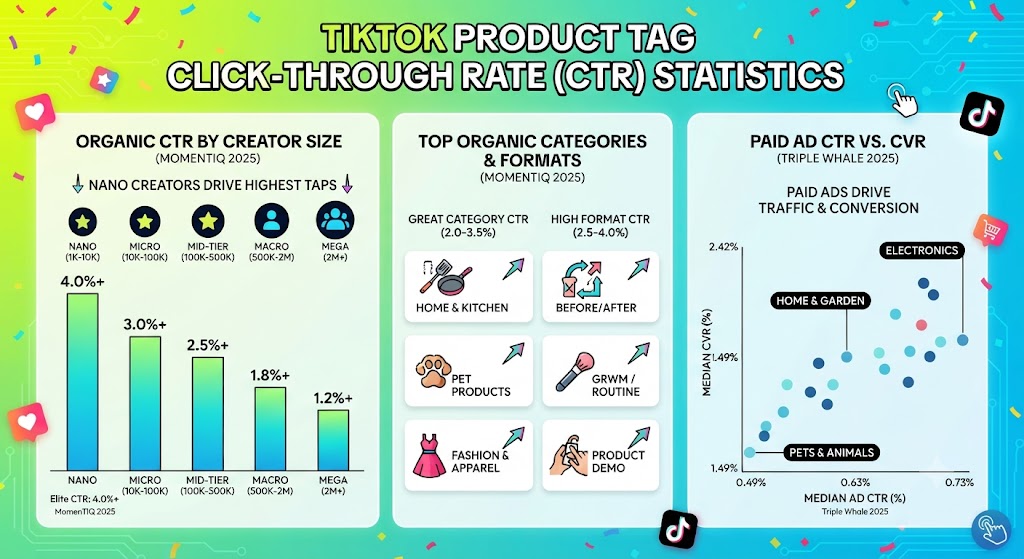
- Elite nano creators with 1K–10K followers exceed 4.0% product tag CTR; elite mega creators above 2M followers top 1.2% (MomentIQ, 2025).
- Home & Kitchen leads category CTR at 2.0–3.5%; Electronics trails at 1.0–1.8% (MomentIQ, 2025).
- Before/after transformation videos post the highest format CTR at 2.5–4.0%; trending-sound clips sit at 0.8–1.5% (MomentIQ, 2025).
- Median paid TikTok ad CTR ran 0.49%–0.73% across ten ecommerce verticals, below the 1.77% blended average (Triple Whale, 2025).
What Counts as a Good TikTok Product Tag Click-Through Rate?
Product CTR measures the share of viewers who tap the product link, product tag, or shop anchor in a video. MomentIQ places the “Great” band at 2.0–3.5% and calls it the single number most tied to Shop revenue.
Anything above the elite thresholds is top-tier: 4.0%+ for nano creators, down to 1.2%+ for mega accounts. These are aggregated benchmark ranges, not a single sampled mean. For context on how tap rates track wider interaction, see TikTok’s engagement rate by follower count.
TikTok Product Tag CTR by Creator Follower Tier
Organic product tag CTR moves inversely with audience size. Smaller creators turn attention into taps at several times the rate of the largest accounts.
| Creator tier (followers) | Good | Great | Elite |
|---|---|---|---|
| Nano (1K–10K) | 1.0–2.0% | 2.0–4.0% | 4.0%+ |
| Micro (10K–100K) | 0.8–1.5% | 1.5–3.0% | 3.0%+ |
| Mid-tier (100K–500K) | 0.5–1.2% | 1.2–2.5% | 2.5%+ |
| Macro (500K–2M) | 0.3–0.8% | 0.8–1.8% | 1.8%+ |
| Mega (2M+) | 0.2–0.5% | 0.5–1.2% | 1.2%+ |
Source: MomentIQ, 2025 benchmarks
The gap is wide. An elite nano creator clears 4.0%, while a “good” mega creator sits at 0.2–0.5%. That spread is why brands seed products across many small accounts rather than a few large ones.
TikTok Product Tag CTR by Product Category
Category is the second-largest driver of tap rate. Visual, demonstrable, impulse-priced goods pull the highest product tag CTR.
| Category | Avg. product tag CTR |
|---|---|
| Home & Kitchen | 2.0–3.5% |
| Pet Products | 1.8–3.0% |
| Fashion & Apparel | 1.5–2.8% |
| Beauty & Skincare | 1.8–2.5% |
| Food & Beverage | 1.5–2.5% |
| Health & Wellness Supplements | 1.2–2.0% |
| Electronics & Tech Accessories | 1.0–1.8% |
Source: MomentIQ, 2025 benchmarks
Home & Kitchen leads because demonstration clips convert curiosity into taps quickly. Electronics sits lowest on a longer consideration cycle. For the full funnel, see the broader TikTok Shop statistics.
TikTok Product Tag CTR by Content Format
The format around the tag matters as much as the product. Proof-driven formats beat pure-reach formats on tap rate.
| Content format | Avg. product tag CTR |
|---|---|
| Before/after transformation | 2.5–4.0% |
| GRWM / routine | 2.2–3.8% |
| Product demo / how-to | 2.0–3.5% |
| Comparison (“this vs. that”) | 2.0–3.5% |
| Storytelling / problem-solution | 1.8–3.0% |
| Unboxing / first impressions | 1.5–2.5% |
| Trending sound / meme | 0.8–1.5% |
Source: MomentIQ, 2025 benchmarks
Before/after content tops the list because visual proof removes skepticism before the tap. Trending-sound videos earn raw reach but low purchase intent, so format choice alone shifts product-page traffic at the same view count.
TikTok Ad CTR and Conversion by Industry
Paid product cards behave differently from organic tags, so these figures measure paid ad clicks, not organic tag taps. Across ecommerce brands on Triple Whale, TikTok’s full-screen video format produced structurally lower ad CTRs than static feeds, while conversion after the click held up.
| Industry | Median ad CTR | Median CVR |
|---|---|---|
| Electronics | 0.73% | 1.85% |
| Apparel & Accessories | 0.69% | 2.37% |
| Home & Garden | 0.68% | 2.42% |
| Beauty | 0.58% | 2.19% |
| Food & Beverage | 0.58% | 2.17% |
| Toys, Art & Collectibles | 0.58% | 2.38% |
| Health & Wellness | 0.57% | 1.68% |
| Lifestyle & Boutique | 0.57% | 2.16% |
| Sports & Outdoors | 0.52% | 1.49% |
| Pets & Animals | 0.49% | 1.91% |
Source: Triple Whale, TikTok ad benchmarks, January–December 2025
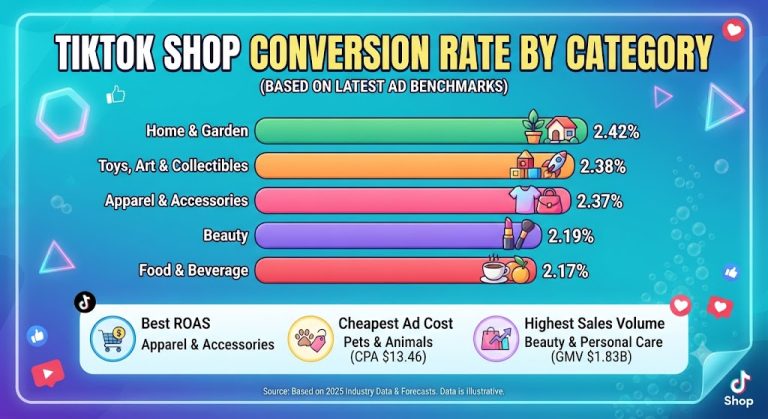
Electronics drew the highest paid CTR at 0.73% but a middling 1.85% CVR. Home & Garden paired a 0.68% CTR with the best conversion in the set at 2.42%. Higher clicks do not guarantee higher conversion.
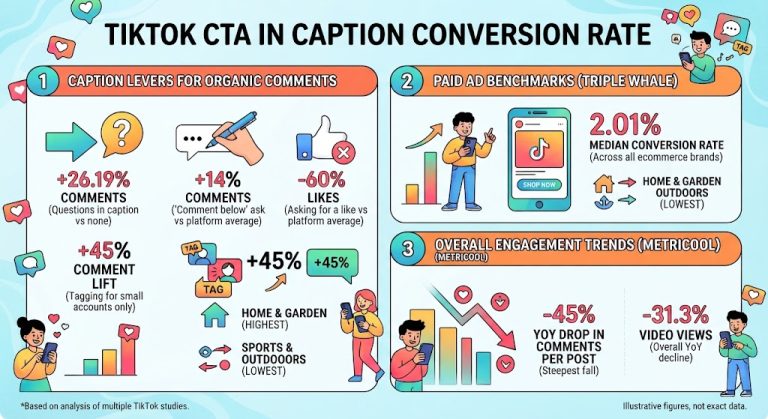
The blended picture shifted year over year. TikTok’s overall ad CTR rose to 1.77% in 2025 from 1.56% in 2024, up 13.74%, while overall CVR slipped 6.2% to 2.01%. Taps got cheaper to earn; the click closed less on its own.
How organic tags and paid cards diverge is covered further in TikTok sponsored versus organic engagement.
What Moves TikTok Product Tag CTR
The tag itself is a measurable lever. MomentIQ reports commerce-tagged content averages a 35% higher CTR than untagged content, citing a Statista analysis of social commerce, so a visible product anchor is not a formality.
Scale amplifies the stakes. US TikTok Shop GMV reached $15.1 billion in 2025, up 68% year over year, per Momentum Works, so small CTR gains compound into real product-page volume.
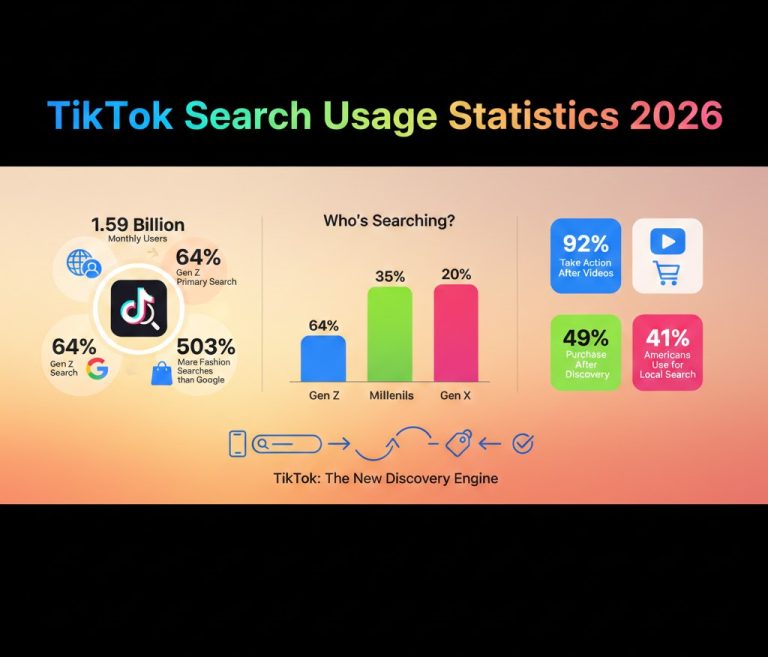
Format and creator size sit on top of that. The best formats roughly triple the tap rate of the worst, and nano creators outrun mega accounts. See brand deal rates by niche and the wider TikTok marketing statistics, plus TikTok search usage for how discovery increasingly starts in search.
FAQs
What is a good TikTok product tag click-through rate?
A CTR of 2.0–3.5% is the “Great” tier for organic Shop content and the metric most tied to Shop revenue, per MomentIQ’s 2025 benchmarks. Elite nano creators exceed 4.0%.
Which creator tier gets the highest product tag CTR?
Nano creators with 1K–10K followers. Their “Great” range is 2.0–4.0% and elite nano clears 4.0%, versus 0.5–1.2% “Great” for mega creators above 2M followers (MomentIQ, 2025).
Which content format drives the highest CTR?
Before/after transformation content, at 2.5–4.0% product tag CTR. Trending-sound and meme videos sit lowest at 0.8–1.5%, per MomentIQ’s 2025 benchmarks.
What is the average TikTok ad CTR by industry?
Median TikTok ad CTR ran 0.49% for Pets & Animals to 0.73% for Electronics across ten ecommerce verticals in 2025, below the 1.77% blended average (Triple Whale).
Does adding a product tag increase clicks?
MomentIQ reports commerce-tagged content averages a 35% higher CTR than untagged content, citing a Statista analysis of social commerce trends (2025).
Sources
https://bemomentiq.com/blog/tiktok-shop-content-performance-benchmarks-what-good-great-elite
https://www.triplewhale.com/blog/tiktok-benchmarks
https://thelowdown.momentum.asia/new-report-tiktok-shop-u-s-gmv-grew-68-to-reach-us15-1b-in-2025/