TikTok Follower-To-Following Ratio Statistics 2026
The median U.S. adult on TikTok follows 154 accounts and has 36 followers, according to Pew Research Center’s observed account data. Khaby Lame follows 81 accounts and had 163,000,000 followers on September 19, 2026, per Social Blade. This page sets out the published counts behind the TikTok follower-to-following ratio: ordinary users, posters against non-posters, who sits on following lists, large creator profiles, and 2026 reach and growth data.
TikTok Follower-To-Following Ratio Statistics 2026
- 154 / 36Accounts followed vs followers, median U.S. adult TikTok user (Pew Research Center, account data as of Nov. 2023)
- 246 / 103Accounts followed vs followers, median U.S. adult user who has posted a video (Pew Research Center, Nov. 2023)
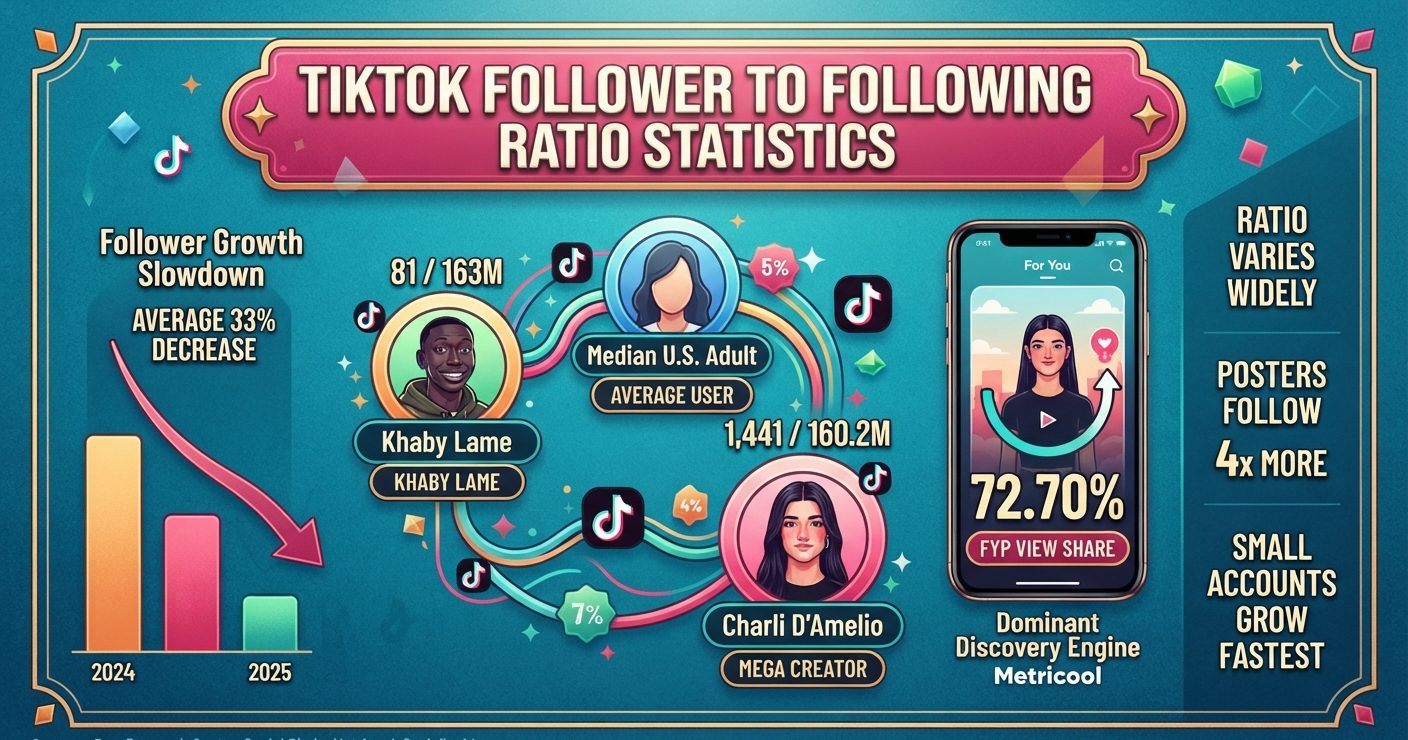
- 81 / 163MAccounts followed vs followers, Khaby Lame (Social Blade, Sept. 19, 2026)
- 72.70%Share of TikTok video views delivered by the For You page, Jan.–Feb. 2026 (Metricool)
- 150% vs 30%2025 follower growth rate, 1K–5K accounts vs 100K–1M accounts (Socialinsider)
What Is the Typical TikTok Follower-to-Following Ratio?
The median U.S. adult TikTok user follows 154 accounts and has 36 followers. Pew Research Center scraped the profiles of 869 survey respondents who shared a valid handle.
Pew publishes the two medians separately and does not publish a ratio. A ratio built from two medians is not the same as the median user’s own ratio.
| U.S. adult TikTok users | Median accounts followed | Median followers | Unweighted sample |
|---|---|---|---|
| All users | 154 | 36 | 869 |
| Posters | 246 | 103 | 446 |
| Non-posters | 63 | 16 | 423 |
Source: Pew Research Center, “How U.S. Adults Use TikTok,” survey Aug. 7–27, 2023, account data as of Nov. 7, 2023
How Posting Changes Both Sides of the Count
A typical poster follows nearly four times as many accounts as a non-poster, and has more followers too, Pew reports.
About 52% of U.S. adult users have ever posted a video. Another 49% have never received a like.
The median poster has six public videos and 149 total likes. How response scales with audience size is tracked in this follower-to-engagement decay data.
The most active 25% of users by posting volume produced 98% of publicly accessible videos from the sample.
Source: Pew Research Center, “How U.S. Adults Use TikTok,” survey Aug. 7–27, 2023, public videos as of Nov. 7, 2023
TikTok Following Counts Range From Under 5 to Over 1,000
| Measure | Accounts followed |
|---|---|
| Median user | 144 |
| Lightest 10% of users | Fewer than 5 |
| Heaviest 10% of users | More than 1,000 |
Source: Pew Research Center, “Who U.S. Adults Follow on TikTok,” 664 U.S. adult users, following lists collected April 8–16, 2024
Pew’s 144 median comes from a different panel and collection date than the 154 figure above. The two numbers are separate snapshots, not a trend.
Users aged 18 to 34 follow more than three times as many accounts as users 50 and older, on average. They also follow more accounts with over 1 million followers.
Source: Pew Research Center, “Who U.S. Adults Follow on TikTok,” April 2024 collection, published Oct. 8, 2024
Who Fills the Following Side: Pew’s 227,946-Account Study
Pew classified 227,946 unique accounts followed by 664 U.S. adults. Small personal accounts under 5,000 followers made up 38%, and individual creators or influencers 46%.
Another 12% were organizations, mega-influencers with over 1 million followers, or people with public prominence outside social media.
About 150,000 accounts were followed by a single panelist. Around 10,600, or 5% of the total, were followed by more than five.
Two randomly selected users would share fewer than two followed accounts on average.
Source: Pew Research Center, “Who U.S. Adults Follow on TikTok,” following lists collected April 8–16, 2024
Mega-Influencers Take a Larger Slice of the Typical List
Accounts with 1 million or more followers are 6% of all followed accounts. They make up around 22% of the typical user’s list.
Small accounts under 5,000 followers are about 25% of a typical list. That share is 15% for the average 18- to 34-year-old and around 30% for users 35 and older.
Source: Pew Research Center, “Who U.S. Adults Follow on TikTok,” April 2024 collection
TikTok Follower-to-Following Ratio of Large Accounts, September 2026
Six large TikTok accounts show no single pattern on the following side. Follower counts run from 86,900,000 to 163,000,000.
| Account | Followers | Following | Likes | Snapshot date |
|---|---|---|---|---|
| Khaby Lame | 163,000,000 | 81 | 2.7B | Sept. 19, 2026 |
| Charli D’Amelio | 160,200,000 | 1,441 | 12.3B | Sept. 23, 2026 |
| MrBeast | 141,200,000 | 355 | 1.5B | Sept. 20, 2026 |
| TikTok (official) | 95,800,000 | 1 | 464.2M | Sept. 21, 2026 |
| Addison Rae | 87,800,000 | 22 | 5.3B | Sept. 21, 2026 |
| Zach King | 86,900,000 | 182 | 1.3B | Sept. 12, 2026 |
Source: Social Blade, TikTok daily channel metrics, Sept. 12–23, 2026
Charli D’Amelio has the longest following list in the group at 1,441 accounts. Her 12.3 billion likes also lead the six.
The official TikTok account follows 1 account. Addison Rae follows 22, up from 19 on September 16, 2026.
Creator-level results on paid posts are compared in these sponsored vs organic TikTok engagement statistics.
Source: Social Blade, TikTok daily channel metrics, Sept. 8–23, 2026
Does the Follower-to-Following Ratio Decide Reach When 72.70% of Views Come From For You?
Metricool’s 2026 TikTok Study found the For You page drove 72.70% of video views. Metricool calls the feed TikTok’s dominant discovery engine.
The study compared 2,314,756 posts from more than 92,000 accounts across January–February 2025 and January–February 2026. Views per post fell 31.30%, reach 28.73% and interactions 31.17%.
Over the same year, 16.47% of TikTok accounts moved into a higher follower category. Metricool reports that share ahead of Instagram, LinkedIn, YouTube, Facebook, X and Pinterest.
Posts reach 96% of their total reach within the first 10 days. Hour-level timing data sits in these TikTok posting time vs reach figures.
Neither Metricool’s release nor Pew’s two reports publishes a follower-to-following ratio metric.
Source: Metricool, 2026 TikTok Study, published May 12, 2026, January–February 2026 vs January–February 2025
Some 85% of U.S. adult users call their For You page at least somewhat interesting, including 40% who say extremely or very. Daily viewing volume is covered in per-user TikTok watch time data.
Source: Pew Research Center, “How U.S. Adults Use TikTok,” survey Aug. 7–27, 2023
Follower Growth Slowed in Every Account Tier in 2025
Socialinsider defines follower growth as followers gained divided by starting followers. Its dataset covers 2 million videos from 214,507 profiles active between January 2024 and December 2025.
| Follower tier | Follower growth 2024 | Follower growth 2025 |
|---|---|---|
| 1K–5K | 269% | 150% |
| 5K–10K | 166% | 115% |
| 10K–50K | 86% | 60% |
| 50K–100K | 55% | 45% |
| 100K–1M | 33% | 30% |
Source: Socialinsider, 2026 TikTok Benchmarks, full-year 2024 and 2025 values, published April 22, 2026
The 1K–5K tier dropped from 269% to 150%. The 100K–1M tier moved from 33% to 30%.
Socialinsider reports an average 33% decrease in audience growth, with the smallest accounts hit hardest.
The 1K–5K tier also had the highest engagement rate by views in 2025, at 4.40%. More on that group is in these TikTok nano-influencer engagement rates.
Source: Socialinsider, 2026 TikTok Benchmarks, January 2024–December 2025
Average Views per Post by Tier
| Follower tier | Views per post 2024 | Views per post 2025 |
|---|---|---|
| 1K–5K | 860 | 350 |
| 5K–10K | 1,575 | 945 |
| 10K–50K | 3,655 | 3,240 |
| 50K–100K | 8,688 | 9,900 |
| 100K–1M | 25,198 | 34,900 |
Source: Socialinsider, 2026 TikTok Benchmarks, full-year 2024 and 2025 values
Views per post fell in the three tiers under 50,000 followers. They rose in the 50K–100K and 100K–1M tiers.
Average comments per post rose from 90 to 100 in the 100K–1M tier. Tier-level comment data is broken out in these TikTok comment-to-view ratio statistics.
Source: Socialinsider, 2026 TikTok Benchmarks, full-year 2024 and 2025 values
FAQs
What is a good follower-to-following ratio on TikTok?
No research body publishes a benchmark. Pew Research Center found the median U.S. adult user follows 154 accounts and has 36 followers, while the median poster follows 246 and has 103, based on November 2023 account data.
Does following too many accounts hurt your TikTok reach?
No published study measures that link. Metricool found the For You page delivered 72.70% of TikTok video views in January–February 2026, a feed it calls the platform’s dominant discovery engine.
How many accounts does the average TikTok user follow?
The median U.S. adult user follows 154 accounts, per Pew’s November 2023 account data. A separate Pew panel of 664 users, observed in April 2024, recorded a median of 144.
Do big TikTok creators follow many accounts?
Counts vary widely. On Social Blade in September 2026, Charli D’Amelio followed 1,441 accounts, MrBeast 355, Khaby Lame 81, Addison Rae 22 and the official TikTok account 1.
Do Reddit threads on TikTok follower-to-following ratios match published data?
Published datasets do not rank ratios or tie them to reach. Pew reports follower and following counts separately, so check any Reddit ratio rule against a named source and its collection date.
Sources
https://www.pewresearch.org/internet/2024/02/22/how-u-s-adults-use-tiktok/
https://www.pewresearch.org/data-labs/2024/10/08/who-u-s-adults-follow-on-tiktok/
https://socialblade.com/tiktok
https://metricool.com/press-release-tiktok-study-2026/
https://www.socialinsider.io/social-media-benchmarks/tiktok
https://insights.ttsvibes.com/tiktok-viral-video-follower-conversion-rate