TikTok Posting Time vs Reach Statistics 2026
Six large studies published for 2026 name six different peak posting hours on TikTok. Only one of them attaches engagement rates to those hours. This page sets the hour-level numbers against the reach mechanics underneath them: For You feed share, posting frequency and post lifespan. Every figure comes from the organisation that ran the analysis, with its sample and period attached.
TikTok Posting Time vs Reach Statistics
What Time Do the 2026 Datasets Say Is Best on TikTok?
Four publishers ran hour-level analyses for 2026. None of them lands on the same peak.
Sprout Social names weekday afternoons as the strongest block. Dash Social ranks that exact window last. Buffer and Dash Social agree only on where the trough sits.
| Publisher | Sample | Metric | Peak window named | Weakest named | Period |
|---|---|---|---|---|---|
| Buffer | 7.1M posts | Median engagement rate | Sunday 9 a.m. | 12 p.m.–5 p.m. | Published Sep 2026 |
| Sprout Social | ~2B engagements, 307,000 profiles | Engagements | Tue–Thu 2–6 p.m. | Weekends | 27 Nov 2025 – 27 Feb 2026 |
| Metricool | 2,314,756 posts, 92,000+ accounts | Views | 6–9 p.m., peak 8 p.m. | Not reported | Jan–Feb 2026 |
| Dash Social | 289,079 posts, 1,000+ brands | Engagement rate | Sunday 4–5 a.m. | Weekdays 2–6 p.m. | 1 Jan – 31 Dec 2024 |
Source: Buffer, Sprout Social, Metricool and Dash Social, periods as listed per row.
Metric choice explains part of the split. Metricool counts view volume, which tracks when people open the app. Buffer and Dash Social use engagement rate, which rewards hours with fewer competing posts.
That is why the rate-based studies surface pre-dawn slots a view-count study would never pick. All four samples are drawn from each publisher’s own scheduling-tool customers.
How Much Does Posting Hour Move TikTok Engagement?
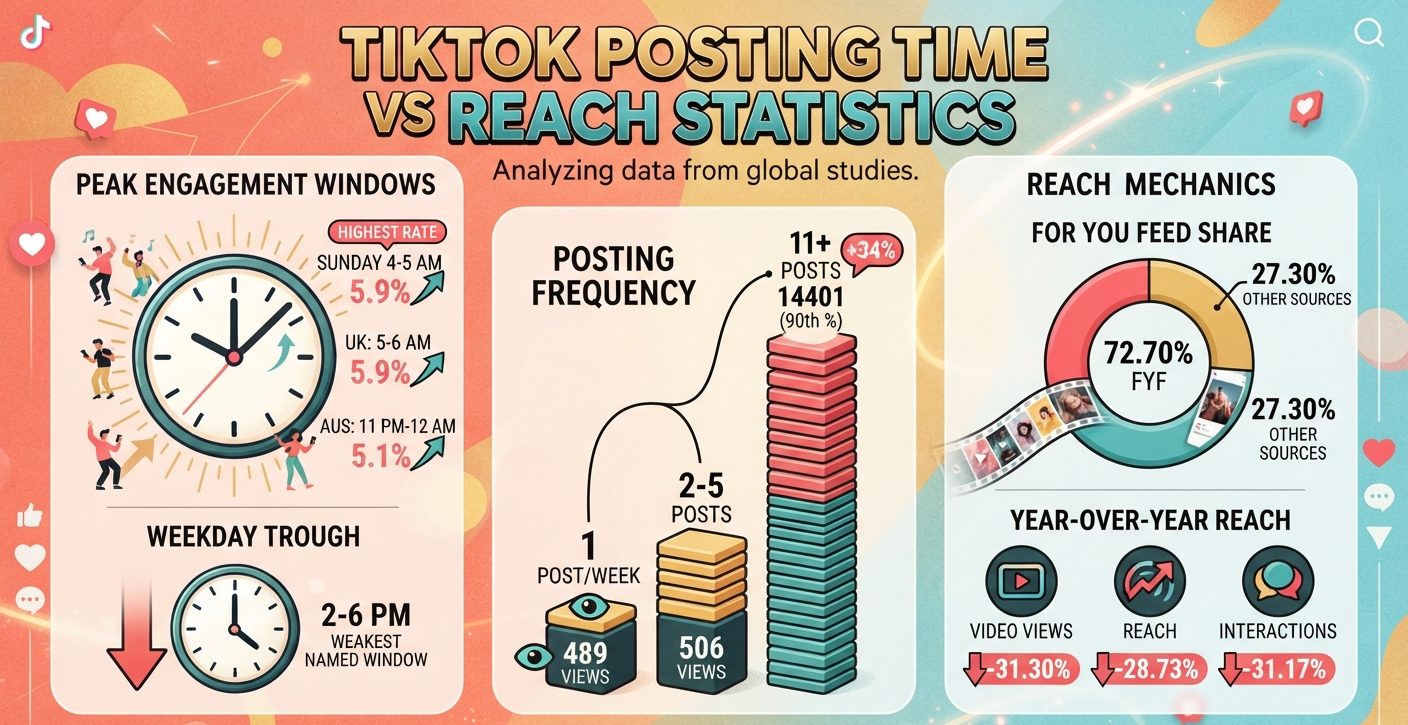
Dash Social is the only 2026-published dataset that puts numbers on individual hours. Six global windows cleared a 5.7% engagement rate across the 2024 brand sample.
The spread between those peaks is two tenths of a percentage point. Dash Social’s own H1 2026 brand benchmark puts average TikTok engagement at 4.4% by views and 3.4% by followers, on accounts averaging 559.9K followers.
Peak and flat hours in the UK sample
The UK segment shows the widest published gap between a single hour and the working day.
| Market | Sample | Best hour | Rate at best hour | Flattest window | Rate in that window |
|---|---|---|---|---|---|
| United Kingdom | 33,000 posts, 137 brands | 5–6 a.m. | 5.9% | 8 a.m.–5 p.m. | 4.4% average |
| Australia | 15,127 posts, 55 brands | 11 p.m.–12 a.m. | 5.1% | 9 a.m.–6 p.m. | 3.2%–3.5% |
Source: Dash Social, brand posts published 1 January to 31 December 2024.
Dash Social attributes the pre-dawn peaks to competition rather than audience size, noting that fewer brands publish in those hours. Whether a post holds the viewers it reaches is a separate question, tracked in TikTok video completion rate data.
TikTok Posting Time vs Reach Statistics Compared With Posting Frequency
Buffer ran a fixed-effects regression across 11.4 million posts from more than 150,000 accounts, comparing each account against itself over time.
Accounts moving from one post a week to two to five got up to 17% more views per post. Six to ten posts returned up to 29%, and 11 or more returned up to 34%.
| Weekly posts | Median views | 90th percentile views | p90/median ratio |
|---|---|---|---|
| 1 post | 489 | 3,722 | 7.6x |
| 2–5 posts | 506 | 6,983 | 13.8x |
| 6–10 posts | 487 | 10,092 | 20.7x |
| 11+ posts | 459 | 14,401 | 31.4x |
Source: Buffer, 11.4 million TikTok posts from 150,000+ accounts, published 8 October 2025.
The median barely moves. Buffer’s data scientist Julian Winternheimer describes TikTok views as heavy-tailed, with frequency raising the ceiling rather than the floor.
Dash Social’s brand sample points the other way. Brands there post eight times a week on average, and those posting fewer than six times a week recorded 93% higher engagement. The cadence question is unpacked further in these TikTok posting frequency figures.
Why TikTok Reach Depends Less on Posting Time in 2026
Metricool analysed 2,314,756 posts from more than 92,000 accounts, comparing January and February 2026 against the same months in 2025.
Nearly three quarters of video views arrive through algorithmic recommendation. Hashtag-driven traffic rose 114% year over year, and posts reach 96% of their total reach within the first 10 days.
Per-post performance fell across every headline metric in the same window.
Publishing volume moved the opposite way. Video posts rose 72.10% and image or carousel posts rose close to 140%, so the accounts measured as reaching fewer people per post are also the ones publishing more.
Metricool’s Juan Pablo Tejela frames this as saturation rather than decline, pointing to 16.47% of TikTok accounts moving into a higher follower band over the year, ahead of Instagram, LinkedIn, YouTube, Facebook, X and Pinterest. Account-size effects are broken out in these follower-to-engagement decay figures and in nano-creator engagement benchmarks.
TikTok Posting Time vs Reach Statistics by Industry
Dash Social broke its brand sample into five industry cuts. All five peak outside standard working hours.
| Industry | Posts analysed | Peak hour (local) |
|---|---|---|
| Beauty | 75,956 | 10–11 p.m. |
| Publishing | 69,162 | 1–2 a.m. and 3–4 a.m. |
| Media | 50,390 | 11 p.m.–12 a.m. |
| Fashion | 49,763 | 6–7 a.m. |
| Retail | 32,962 | 6–7 a.m. |
Source: Dash Social, brand posts published 1 January to 31 December 2024.
Retail is the one industry both publishers cover, and they land eight hours apart. Sprout Social puts retail’s best windows at Mondays to Fridays between 2 p.m. and 4 p.m., against 6 a.m. to 7 a.m. in the Dash Social sample.
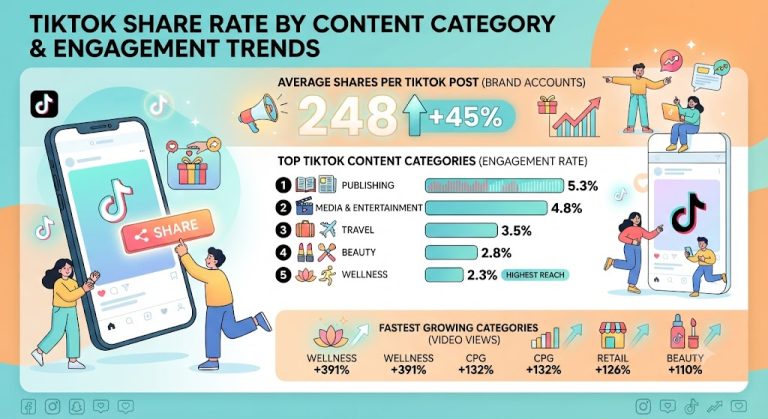
Sprout’s other industry windows also sit inside the working day: food and beverage at 3 p.m. to 6 p.m. Monday to Thursday, healthcare at 11 a.m. to 7 p.m. on Wednesdays, travel and hospitality at 4 p.m. to 6 p.m. Monday to Thursday. Category-level engagement patterns are covered further in these TikTok share rate benchmarks.
What TikTok Posting Time vs Reach Statistics Do Not Measure
No 2026 dataset reports reach or impressions broken out by posting hour. Every hour-level figure above measures engagement, and Metricool’s view-based ranking carries no percentages.
Buffer, Sprout Social and Metricool publish rankings without effect sizes, which leaves Dash Social’s 2024 brand data as the only quantified hour spread. That sample excludes creator accounts entirely.
Buffer states plainly that timing cannot rescue a weak post, and points to watch time as the signal to fix first. Search-driven views go unseparated by hour in every dataset, a gap visible in TikTok search usage data and in how saves are folded into composite engagement rates.
FAQs
What is the best time to post on TikTok?
No single hour. Buffer names Sunday 9 a.m. across 7.1 million posts, Sprout Social names Tuesday to Thursday 2 p.m. to 6 p.m., Metricool names 8 p.m., and Dash Social names Sunday 4 a.m. to 5 a.m.
Does posting time affect TikTok reach?
Only partly. Metricool found 72.70% of video views come from the For You feed and 96% of reach arrives within 10 days, so most distribution is assigned after the publishing hour passes.
How often should you post on TikTok?
Buffer found up to 34% more views per post at 11 or more posts a week across 11.4 million posts. Dash Social found brands posting fewer than six times a week recorded 93% higher engagement.
Do Reddit threads match what the TikTok posting time studies found?
No 2026 dataset uses Reddit discussion as a source. Creator threads trade anecdotes; the published studies measure posts. The four largest studies each name a different peak hour, so disagreement exists in both places.
What is the worst time to post on TikTok?
Dash Social names weekdays 2 p.m. to 6 p.m. as the weakest window. Buffer names 12 p.m. to 5 p.m. Sprout Social names weekends, which is the direct opposite of Buffer’s strongest day.
Sources
https://buffer.com/resources/best-time-to-post-on-tiktok/
https://buffer.com/resources/how-often-should-you-post-on-tiktok/
https://metricool.com/press-release-tiktok-study-2026/
https://www.dashsocial.com/blog/best-time-to-post-on-tiktok
https://sproutsocial.com/insights/best-times-to-post-on-tiktok/
https://www.quantumrun.com/consulting/tiktok-users/