TikTok Follower Growth Rate by Niche Statistics 2026
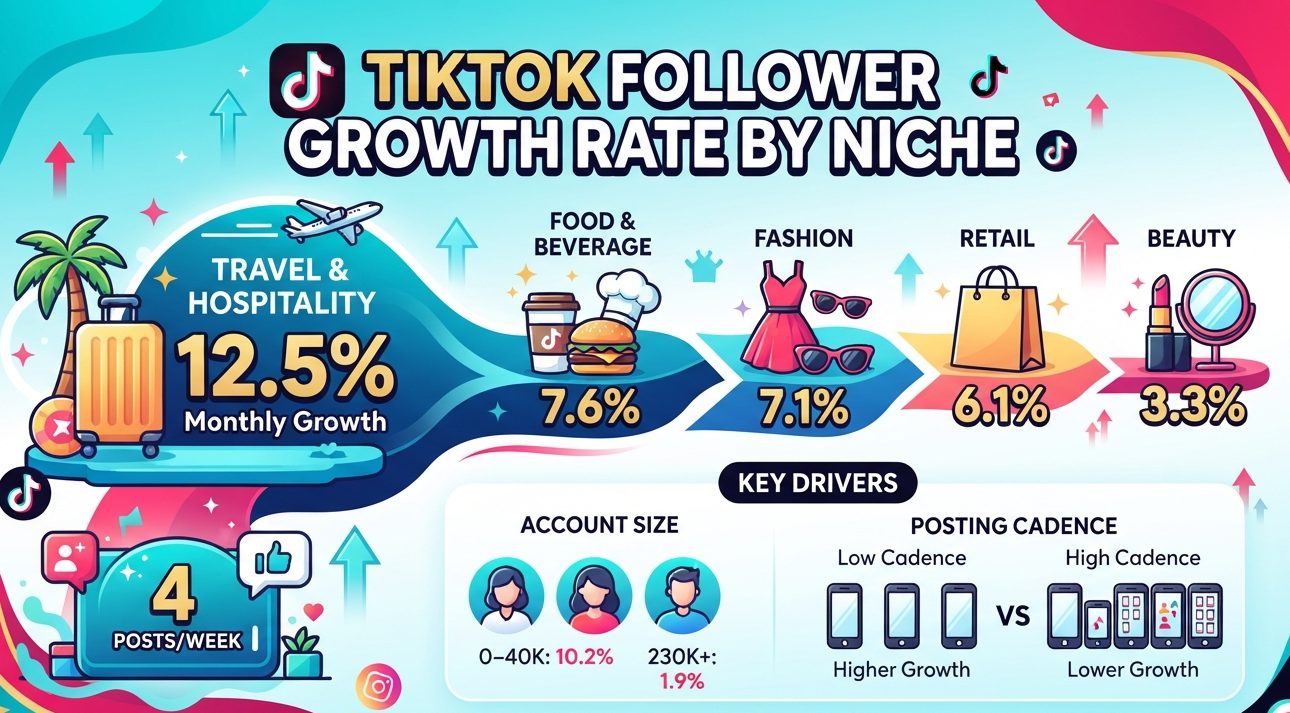
Travel and hospitality brands added TikTok followers at an average 12.5% a month in the second half of 2025. Beauty brands managed 3.3%.
This guide to TikTok follower growth rate by niche sets Dash Social’s 12-industry benchmarks beside Hootsuite’s weekly figures, then checks both against account size, rival platforms and falling per-post views in 2026 data.
TikTok Follower Growth Rate by Niche Statistics
Which Niche Has the Highest TikTok Follower Growth Rate? Travel Brands at 12.5% a Month
Dash Social’s H1 2026 report tracks average monthly follower growth for brand accounts in 12 industries. Travel and hospitality leads at 12.5%, ahead of food and beverage at 7.6% and fashion at 7.1%.
Beauty ranks last at 3.3%, with CPG at 3.5% and luxury at 3.6%. The all-industry average is 5.0%, and seven of the 12 industries fall below it.
The sample covers 1,360 brands with at least 1,000 followers, active from July 1 to December 31, 2025. Growth figures use Dash Social customer data and include organic, boosted and promoted posts, but exclude paid ads.
Source: Dash Social, H1 2026 TikTok Benchmark Report, July–December 2025
Does Posting More Lift Niche Growth?
Travel and hospitality posts four times a week, tied for the lowest cadence in the report, and still grows fastest. Media and entertainment posts 18 times a week and grows 4.1% a month.
Dash Social reports that brands posting fewer than six times weekly see 93% higher engagement. That figure measures engagement, not follower growth.
The report does not split growth by posting hour, a variable covered in these TikTok posting time and reach statistics from other studies.
Source: Dash Social, H1 2026 TikTok Benchmark Report, July–December 2025
Hootsuite’s 2026 Benchmarks: TikTok Follower Growth Rate by Industry
| Industry | TikTok | X (Twitter) | |||
|---|---|---|---|---|---|
| Dining, hospitality, and tourism | 18.75% | 1.10% | 9.11% | 0.45% | 0.00% |
| Marketing agencies | 6.08% | 1.36% | 1.62% | 1.38% | 0.00% |
| Education | 2.28% | Not published | Not published | Not published | Not published |
| Nonprofits | 2.15% | 0.62% | 0.57% | 0.48% | 0.00% |
| Technology | 2.03% | 0.68% | 199.09% | 0.63% | 0.00% |
| Healthcare | 1.82% | 1.10% | 10.11% | 0.94% | 0.00% |
| Construction, mining, and manufacturing | 1.71% | 1.71% | 0.37% | 0.87% | 0.00% |
| Real estate, legal, and other professional | 1.62% | 0.97% | 1.60% | 0.90% | 0.00% |
| Entertainment and media | 1.51% | 1.82% | 0.51% | 1.08% | 0.15% |
| Financial services | 0.98% | 2.26% | -0.61% | 0.51% | 0.00% |
| Retail | 0.91% | 1.02% | 2.43% | 0.57% | 0.03% |
| Government-related services | 0.70% | 2.17% | 1.38% | 0.39% | 0.00% |
Source: Hootsuite, Social Media Benchmarks: 2026 Data + Tips, average weekly follower growth, published April 14, 2026, updated July 4, 2026
Dining, hospitality, and tourism tops the TikTok column at 18.75% a week. Government-related services trails at 0.70%, with retail at 0.91%.
Ten of the 12 industries sit between 0.70% and 2.28% weekly on TikTok.
Hootsuite also publishes an overall TikTok figure of 197.37% a week, above every industry row in the same post. The post does not explain that gap or state its sample size.
Where TikTok Outgrows Instagram and Facebook
TikTok posts the highest weekly rate of the five platforms in four of 11 comparable industries: dining, marketing agencies, nonprofits, and real estate, legal and professional services. It ties Instagram at 1.71% in construction, mining and manufacturing.
Instagram leads in entertainment and media, financial services and government. Facebook leads in healthcare at 10.11%, retail at 2.43% and technology at 199.09%.
X records 0.00% weekly growth in nine of the 11 industries.
Source: Hootsuite, Social Media Benchmarks: 2026 Data + Tips, updated July 4, 2026
Retail Ranks 5th in One Dataset and 11th in Another
Retail shows the sharpest split between the two niche datasets. Dash Social puts it fifth of 12 at 6.1% monthly growth. Hootsuite ranks it 11th of 12 at 0.91% weekly.
The figures use different periods, samples and industry definitions. They cannot be merged into one ranking.
Hospitality is where the two agree. Travel and hospitality tops Dash Social at 12.5% a month, and dining, hospitality, and tourism tops Hootsuite at 18.75% a week.
Media sits in the lower half of both: eighth in Dash Social at 4.1% monthly, ninth in Hootsuite at 1.51% weekly.
Neither source tracks creator content niches such as gaming, comedy or personal finance. Both publish industry categories for brand and organisation accounts.
Source: Dash Social, H1 2026 TikTok Benchmark Report, July–December 2025; Hootsuite, 2026 benchmarks, updated July 4, 2026
Does Account Size Matter More Than Niche for TikTok Follower Growth Rate?
Dash Social’s size tiers span 1.9% to 10.2% monthly growth. Its industry averages span 3.3% to 12.5%.
Dash Social: Three Brand Tiers
| Tier | Follower range | Average monthly follower growth |
|---|---|---|
| Growing Brands | 0–40K | 10.2% |
| Established Brands | 40K–230K | 2.6% |
| Large Brands | 230K+ | 1.9% |
Source: Dash Social, H1 2026 TikTok Benchmark Report, July–December 2025
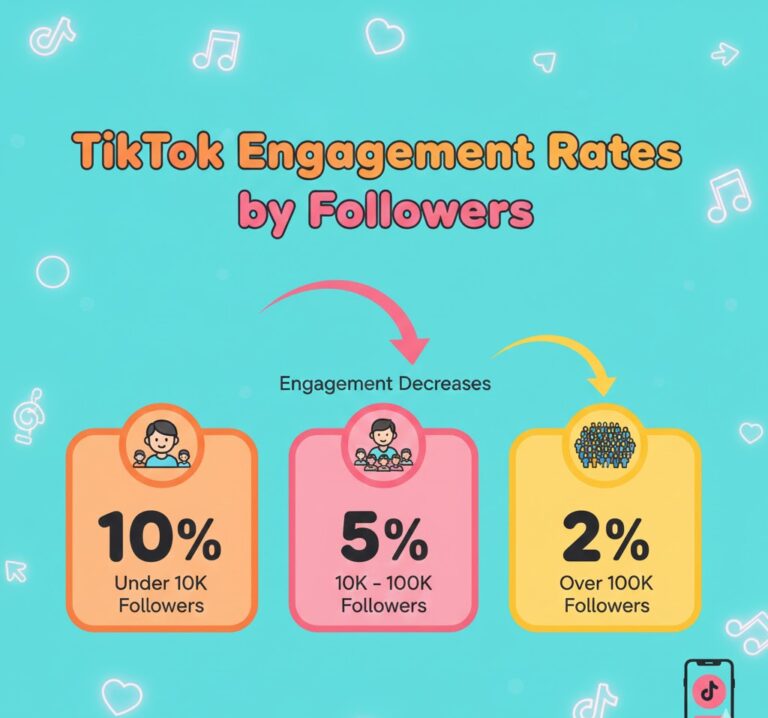
Brands under 40,000 followers averaged 10.2% monthly growth. The rate drops to 2.6% for established brands and 1.9% above 230,000 followers.
A single breakout post is one route into a higher tier, tracked separately in figures on how viral TikTok videos convert into followers.
Socialinsider: Five Profile Bands, 2024 vs 2025
Socialinsider measured growth as followers gained divided by starting followers. The dataset covers 2 million videos from 214,507 profiles active between January 2024 and December 2025.
Every band slowed in 2025. Profiles with 1K–5K followers fell from 269% to 150%, while 100K–1M profiles moved from 33% to 30%.
Socialinsider describes an average 33% decrease, with smaller accounts hit hardest. Brands raised posting frequency by an average 40% over the same period.
The report advises tracking follows per video rather than total growth, an approach also covered in this guide to building a TikTok following.
Unfollows and fake-follower purges are a separate measure, covered in this breakdown of TikTok follower churn.
Source: Socialinsider, 2026 TikTok Benchmarks, January 2024–December 2025
TikTok Views Per Post Fell 31.30% as Accounts Kept Moving Up Tiers
TikTok accounts that moved into a higher follower tier
TikTok accounts under 100K followers that grew
Metricool compared 2,314,756 TikTok posts from more than 92,000 accounts, January–February 2025 against January–February 2026. Views per post fell 31.30%, reach 28.73% and interactions 31.17%.
Follower growth held up in the same window. TikTok’s 16.47% tier-advancement rate beat Instagram, LinkedIn, YouTube, Facebook, X and Pinterest in Metricool’s data, and 44% of accounts under 100,000 followers grew.
Publishing volume climbed as well, with videos up 72.10% and image or carousel posts up nearly 140%. Metricool links the per-post decline to content saturation; TikTok scroll-past rates show how fast viewers skip in that crowded feed.
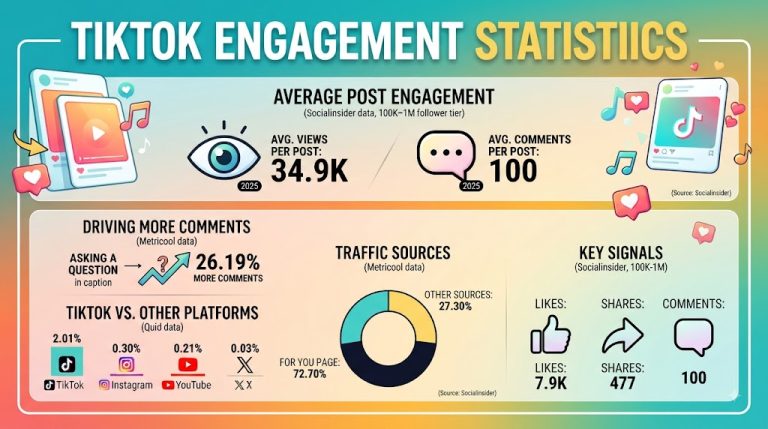
The For You page drove 72.70% of video views, and search-to-video click-through data covers a second discovery route Metricool does not split out.
Hashtag-driven traffic rose 114% year over year; for how long that traffic lasts, see this TikTok hashtag reach decay data.
Source: Metricool, 2026 TikTok Study, January–February 2025 vs January–February 2026
FAQs
Which niche grows fastest on TikTok?
Travel and hospitality. Dash Social measured 12.5% average monthly follower growth for travel and hospitality brands in July–December 2025, ahead of food and beverage at 7.6%. Hootsuite also ranks dining, hospitality, and tourism first, at 18.75% weekly.
What is a good follower growth rate on TikTok?
Brand accounts averaged 5.0% monthly follower growth on TikTok in July–December 2025, per Dash Social. Brands under 40K followers averaged 10.2%, and brands above 230K averaged 1.9%.
Which industry grows slowest on TikTok?
Beauty ranks lowest in Dash Social’s 12 industries at 3.3% monthly. In Hootsuite’s 2026 benchmarks, government-related services grow slowest at 0.70% weekly, followed by retail at 0.91%.
Is TikTok follower growth slowing down?
Yes. Socialinsider reports growth fell in every account size band from 2024 to 2025. Profiles with 1K–5K followers dropped from 269% to 150%, and 100K–1M profiles slipped from 33% to 30%.
Is Reddit right that picking a niche speeds up TikTok growth?
No published dataset measures creator niches, so that Reddit claim stays untested. Dash Social’s brand data shows industry averages from 3.3% to 12.5% monthly and size-tier averages from 1.9% to 10.2%.
Sources
https://pages.dashsocial.com/hubfs/social-media-benchmark/2026/H1/tiktok.pdf
https://blog.hootsuite.com/social-media-benchmarks/
https://www.socialinsider.io/social-media-benchmarks/tiktok
https://metricool.com/press-release-tiktok-study-2026/
https://insights.ttsvibes.com/tiktok-average-follower-count-by-account-age/